## Light Curve Analysis: KMT-2017-BLG-1194
### Overview
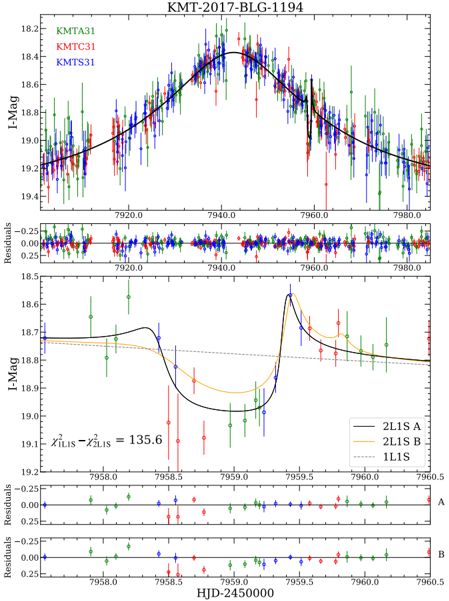
The image presents a series of light curves and residual plots for the astronomical object KMT-2017-BLG-1194. The top section displays the overall light curve with data from three different telescopes (KMTA31, KMTC31, KMTS31) along with a fitted model. The bottom section focuses on a specific region of the light curve, showing data fitted with different models (2L1S A, 2L1S B, 1L1S) and their corresponding residuals.
### Components/Axes
**Top Chart:**
* **Title:** KMT-2017-BLG-1194
* **Y-axis:** I-Mag (I-band Magnitude), ranging from approximately 18.2 to 19.4.
* **X-axis:** HJD-2450000 (Heliocentric Julian Date minus 2450000), ranging from approximately 7920.0 to 7980.0.
* **Data Series:**
* KMTA31: Blue data points with error bars.
* KMTC31: Red data points with error bars.
* KMTS31: Green data points with error bars.
* Model Fit: A black line representing the overall fitted model to the data.
* **Residuals Plot (Top):**
* Y-axis: Residuals, ranging from approximately -0.25 to 0.25.
* X-axis: HJD-2450000, ranging from approximately 7920.0 to 7980.0.
* Data points: Blue, Red, and Green, corresponding to KMTA31, KMTC31, and KMTS31 respectively.
**Bottom Chart:**
* **Y-axis:** I-Mag (I-band Magnitude), ranging from approximately 18.5 to 19.2.
* **X-axis:** HJD-2450000 (Heliocentric Julian Date minus 2450000), ranging from approximately 7958.0 to 7960.5.
* **Data Series:**
* 2L1S A: Black line.
* 2L1S B: Orange line.
* 1L1S: Dashed gray line.
* **Residuals Plots (Bottom):**
* Y-axis: Residuals, ranging from approximately -0.25 to 0.25.
* X-axis: HJD-2450000, ranging from approximately 7958.0 to 7960.5.
* Plot A: Residuals for model A.
* Plot B: Residuals for model B.
* **Text:**
* χ²<sub>1L1S</sub> - χ²<sub>2L1S</sub> = 135.6
### Detailed Analysis
**Top Chart:**
* **KMTA31 (Blue):** The blue data points show a general trend of increasing I-Mag values from HJD-2450000 = 7920 to a peak around 7940, then decreasing to 7980.
* **KMTC31 (Red):** The red data points follow a similar trend to the blue data, with a peak around HJD-2450000 = 7940.
* **KMTS31 (Green):** The green data points also follow the same trend, peaking around HJD-2450000 = 7940.
* **Model Fit (Black):** The black line represents a smooth curve that fits the overall trend of the data points. It peaks around HJD-2450000 = 7940.
**Top Residuals Plot:**
* The residuals appear to be randomly distributed around zero, indicating a good fit of the model to the data.
**Bottom Chart:**
* **2L1S A (Black):** The black line shows a sharp dip in I-Mag around HJD-2450000 = 7958.7, followed by a rapid increase.
* **2L1S B (Orange):** The orange line shows a similar dip in I-Mag, but slightly less pronounced than the black line.
* **1L1S (Dashed Gray):** The dashed gray line represents a flatter curve, with a slight dip around HJD-2450000 = 7958.7.
**Bottom Residuals Plots:**
* The residuals for both models A and B appear to be randomly distributed around zero, but with some noticeable deviations around the dip in I-Mag.
### Key Observations
* The top chart shows a general brightening of the object around HJD-2450000 = 7940.
* The bottom chart focuses on a specific event, likely a microlensing event, around HJD-2450000 = 7958.7.
* The value χ²<sub>1L1S</sub> - χ²<sub>2L1S</sub> = 135.6 suggests that the 2L1S model provides a significantly better fit to the data than the 1L1S model.
### Interpretation
The data suggests that KMT-2017-BLG-1194 experienced a microlensing event. The top chart shows the overall light curve, while the bottom chart zooms in on the microlensing event. The different models (2L1S A, 2L1S B, 1L1S) represent different interpretations of the event, with the 2L1S model providing a better fit to the data. The residuals plots help to assess the quality of the fit for each model. The difference in chi-squared values (χ²<sub>1L1S</sub> - χ²<sub>2L1S</sub> = 135.6) indicates that the 2L1S model is statistically more significant than the 1L1S model. The different colors in the top chart represent data from different telescopes, which helps to improve the accuracy and reliability of the light curve.