\n
## Light Curve Analysis: KMT-2017-BLG-1194
### Overview
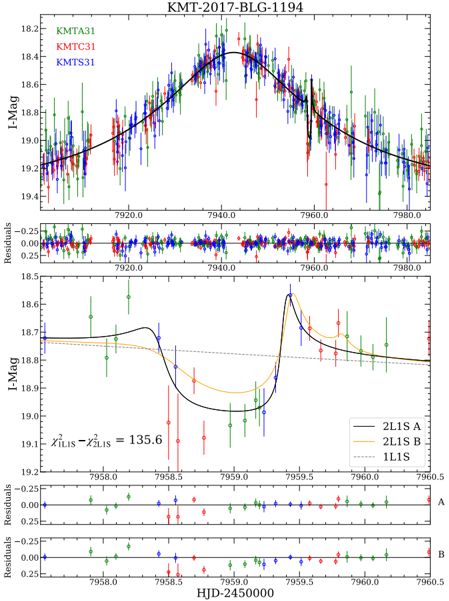
The image presents a light curve analysis of the variable star KMT-2017-BLG-1194. It consists of two main panels: a broader view of the light curve spanning a longer time period, and a zoomed-in view focusing on a specific event. Below each light curve are residual plots showing the difference between the observed data and the fitted model. The data is presented as magnitude (I-Mag) versus time (HJD-2450000).
### Components/Axes
* **Title:** KMT-2017-BLG-1194
* **X-axis (both panels):** HJD-2450000 (Heliocentric Julian Date - 2450000)
* **Y-axis (top panel & zoomed panel):** I-Mag (Magnitude in the I-band)
* **Y-axis (residual plots):** Residuals (difference between observed and modeled magnitude)
* **Legend (top panel):**
* KMTA31 (Green)
* KMTC31 (Blue)
* KMTS31 (Red)
* **Legend (zoomed panel):**
* 2LIS A (Black)
* 2LIS B (Orange)
* 1LIS (Purple)
* **Equation (zoomed panel):** χ<sup>2</sup><sub>LIS</sub> - χ<sup>2</sup><sub>2LIS</sub> = 135.6
### Detailed Analysis or Content Details
**Top Panel (Broad Light Curve):**
* The x-axis ranges from approximately 7920 to 7980 HJD-2450000.
* The y-axis ranges from approximately 18.2 to 19.4 I-Mag.
* The data points are scattered, with error bars indicating uncertainty.
* KMTA31 (Green): Data points show a general upward trend from approximately 19.2 I-Mag at 7920 HJD-2450000 to a peak around 18.3 I-Mag at 7940 HJD-2450000, then a decline to approximately 19.0 I-Mag at 7980 HJD-2450000.
* KMTC31 (Blue): Similar trend to KMTA31, but with more scatter. Starts around 19.3 I-Mag at 7920 HJD-2450000, peaks around 18.4 I-Mag at 7940 HJD-2450000, and ends around 19.1 I-Mag at 7980 HJD-2450000.
* KMTS31 (Red): Similar trend, but with even more scatter. Starts around 19.4 I-Mag at 7920 HJD-2450000, peaks around 18.5 I-Mag at 7940 HJD-2450000, and ends around 19.2 I-Mag at 7980 HJD-2450000.
* A black line represents a fitted model, generally following the upward and downward trends of the data. A blue line also represents a fitted model, but is flatter.
**Residual Plots (Top Panel):**
* The x-axis matches the top panel (7920 to 7980 HJD-2450000).
* The y-axis ranges from -0.25 to 0.25 for the residuals.
* Residuals for KMTA31 (Green), KMTC31 (Blue), and KMTS31 (Red) are plotted. The residuals appear randomly scattered around zero, indicating a reasonable fit of the model to the data.
**Bottom Panel (Zoomed Light Curve):**
* The x-axis ranges from approximately 7958.0 to 7960.5 HJD-2450000.
* The y-axis ranges from approximately 18.5 to 19.1 I-Mag.
* 2LIS A (Black): Shows a sharp peak around 7959.0 HJD-2450000, reaching approximately 18.6 I-Mag.
* 2LIS B (Orange): Shows a similar peak, but slightly less pronounced, around 7959.0 HJD-2450000, reaching approximately 18.7 I-Mag.
* 1LIS (Purple): Shows a broader peak around 7959.0 HJD-2450000, reaching approximately 18.8 I-Mag.
**Residual Plots (Bottom Panel):**
* The x-axis matches the zoomed panel (7958.0 to 7960.5 HJD-2450000).
* The y-axis ranges from -0.25 to 0.25 for the residuals.
* Residuals for 2LIS A (Black), 2LIS B (Orange), and 1LIS (Purple) are plotted. The residuals appear randomly scattered around zero, indicating a reasonable fit of the model to the data.
### Key Observations
* The broad light curve shows a clear microlensing event, with a peak around 7940 HJD-2450000.
* The zoomed light curve reveals a more detailed structure of the event, potentially indicating multiple peaks or a complex lens system.
* The residual plots suggest that the fitted models provide a good representation of the observed data.
* The χ<sup>2</sup> value indicates the quality of the fit. A lower value generally indicates a better fit.
### Interpretation
The image presents a light curve analysis of a microlensing event. Microlensing occurs when a massive object (like a star or black hole) passes between Earth and a distant source star, causing the source star to appear brighter. The shape of the light curve provides information about the mass and distance of the lensing object.
The two panels provide different levels of detail. The broad light curve shows the overall shape of the event, while the zoomed light curve reveals finer details. The residual plots confirm that the fitted models are consistent with the observed data.
The χ<sup>2</sup> value of 135.6 suggests a reasonable, but not necessarily perfect, fit of the models to the data. The difference between the χ<sup>2</sup> values for the 2LIS and 1LIS models suggests that the 2LIS model provides a better fit.
The presence of multiple peaks in the zoomed light curve could indicate a binary lens system, where two objects are acting as the lens. Further analysis would be needed to confirm this hypothesis. The different colors represent data from different telescopes (KMTA31, KMTC31, KMTS31), allowing for cross-validation and improved accuracy. The overall data suggests a complex microlensing event, potentially involving multiple lenses or a complex lens geometry.