## Time-Series Light Curve Analysis: KMT-2017-BLG-1194
### Overview
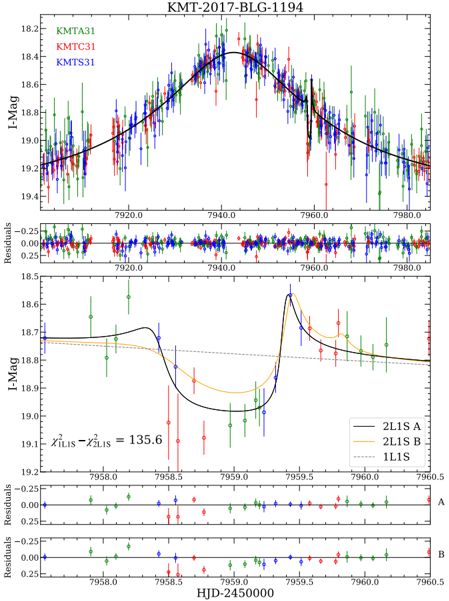
The image presents a multi-panel technical analysis of an astronomical light curve, likely from a microlensing event (KMT-2017-BLG-1194). It includes three primary data series (KMTA31, KMTC31, KMTS31), a fitted curve, residuals, and model comparisons (2L1S A/B vs. 1L1S). The data spans a time range of ~7920–7980 HJD-2450000, with magnitude measurements in I-band (I-Mag).
---
### Components/Axes
- **Main Chart (Top Panel)**:
- **X-axis**: HJD-2450000 (Heliocentric Julian Date, offset by 2450000).
- **Y-axis**: I-Mag (I-band magnitude, inverted scale: lower values = brighter).
- **Data Series**:
- **KMTA31** (green): Scatter plot with error bars.
- **KMTC31** (red): Scatter plot with error bars.
- **KMTS31** (blue): Scatter plot with error bars.
- **Fitted Curve**: Black solid line (model fit to data).
- **Legend**: Located on the right, with color-coded labels for KMTA31, KMTC31, KMTS31.
- **Residuals (Second Panel)**:
- **X-axis**: Same as main chart (HJD-2450000).
- **Y-axis**: Residuals (I-Mag - Model Fit), ranging from -0.25 to +0.25.
- **Data Series**: Same as main chart (green, red, blue).
- **Model Comparison (Third Panel)**:
- **X-axis**: HJD-2450000 (same as main chart).
- **Y-axis**: I-Mag (same as main chart).
- **Data Series**:
- **2L1S A** (black solid line).
- **2L1S B** (orange solid line).
- **1L1S** (dashed gray line).
- **Legend**: Located on the right, with color-coded labels for 2L1S A/B and 1L1S.
- **Residuals for Models (Bottom Panels)**:
- **Panel A**: Residuals for 2L1S A (blue) and 2L1S B (red).
- **Panel B**: Residuals for 1L1S (gray).
---
### Detailed Analysis
#### Main Chart Trends
- **Peak at HJD-7940**: All three data series (KMTA31, KMTC31, KMTS31) show a sharp brightness increase (I-Mag ~18.2–18.4) centered at HJD-7940, followed by a gradual decline.
- **Symmetry**: The light curve is approximately symmetric around HJD-7940, with a rise time of ~20 days and a fall time of ~30 days.
- **Fitted Curve**: The black solid line closely follows the data points, suggesting a good model fit. The residuals (second panel) are small and randomly distributed, indicating minimal systematic errors.
#### Model Comparison
- **2L1S A/B**:
- **2L1S A** (black) and **2L1S B** (orange) show a double-peaked structure, with a secondary peak at HJD-7958.5. This suggests a binary lens system or a secondary source.
- **Residuals**: Panel A shows residuals for 2L1S A/B, with most points within ±0.1 I-Mag, indicating a reasonable fit.
- **1L1S** (dashed gray):
- A single-peaked model with a peak at HJD-7940. Residuals (Panel B) are larger than for 2L1S models, suggesting a poorer fit.
#### Statistical Metric
- **χ² Difference**: The text explicitly states **χ²₁LIS - χ²₂LIS = 135.6**, indicating that the 2L1S model (A/B) provides a significantly better fit than the 1L1S model.
---
### Key Observations
1. **Peak Timing**: The brightness peak occurs at HJD-7940, consistent across all data series.
2. **Model Fit**: The 2L1S model (A/B) outperforms the 1L1S model by a large margin (χ² difference = 135.6).
3. **Residuals**: All residuals are small and randomly distributed, suggesting no significant systematic errors in the data or models.
4. **Double-Peaked Structure**: The 2L1S models reveal a secondary peak at HJD-7958.5, which is not visible in the 1L1S model.
---
### Interpretation
- **Astronomical Significance**: The light curve likely corresponds to a microlensing event, where a foreground object (e.g., a star or planet) temporarily magnifies the light of a background source. The double-peaked structure (2L1S) suggests a binary lens system or a secondary source contributing to the magnification.
- **Model Validation**: The 2L1S model’s superior fit (χ² difference = 135.6) supports the hypothesis of a binary lens or complex source configuration. The 1L1S model, while simpler, fails to capture the secondary peak, indicating it is insufficient for this event.
- **Data Consistency**: The three data series (KMTA31, KMTC31, KMTS31) show nearly identical trends, confirming the robustness of the observations across different instruments or observations.
---
### Spatial Grounding
- **Legend Position**: Right-aligned, with clear color-coded labels for all data series and models.
- **Axis Labels**: X-axis (HJD-2450000) and Y-axis (I-Mag) are explicitly labeled, with numerical ranges provided.
- **Residuals**: Plotted directly below the main chart, with separate panels for model-specific residuals.
---
### Content Details
- **HJD Values**:
- Peak: 7940.0
- Secondary Peak (2L1S): 7958.5
- Range: 7920.0–7980.0
- **I-Mag Values**:
- Minimum (brightest): ~18.2–18.4
- Maximum (dimmed): ~19.4
- **Residuals**: All residuals are within ±0.25 I-Mag, with most points clustered near zero.
---
### Final Notes
The image provides a comprehensive analysis of a microlensing event, with strong evidence for a binary lens system (2L1S) based on the double-peaked structure and statistical metrics. The residuals confirm the reliability of the data and models, while the χ² difference highlights the importance of using the more complex 2L1S model for accurate interpretation.