## Bar Charts: Accuracy vs. Confidence Before and After Calibration
### Overview
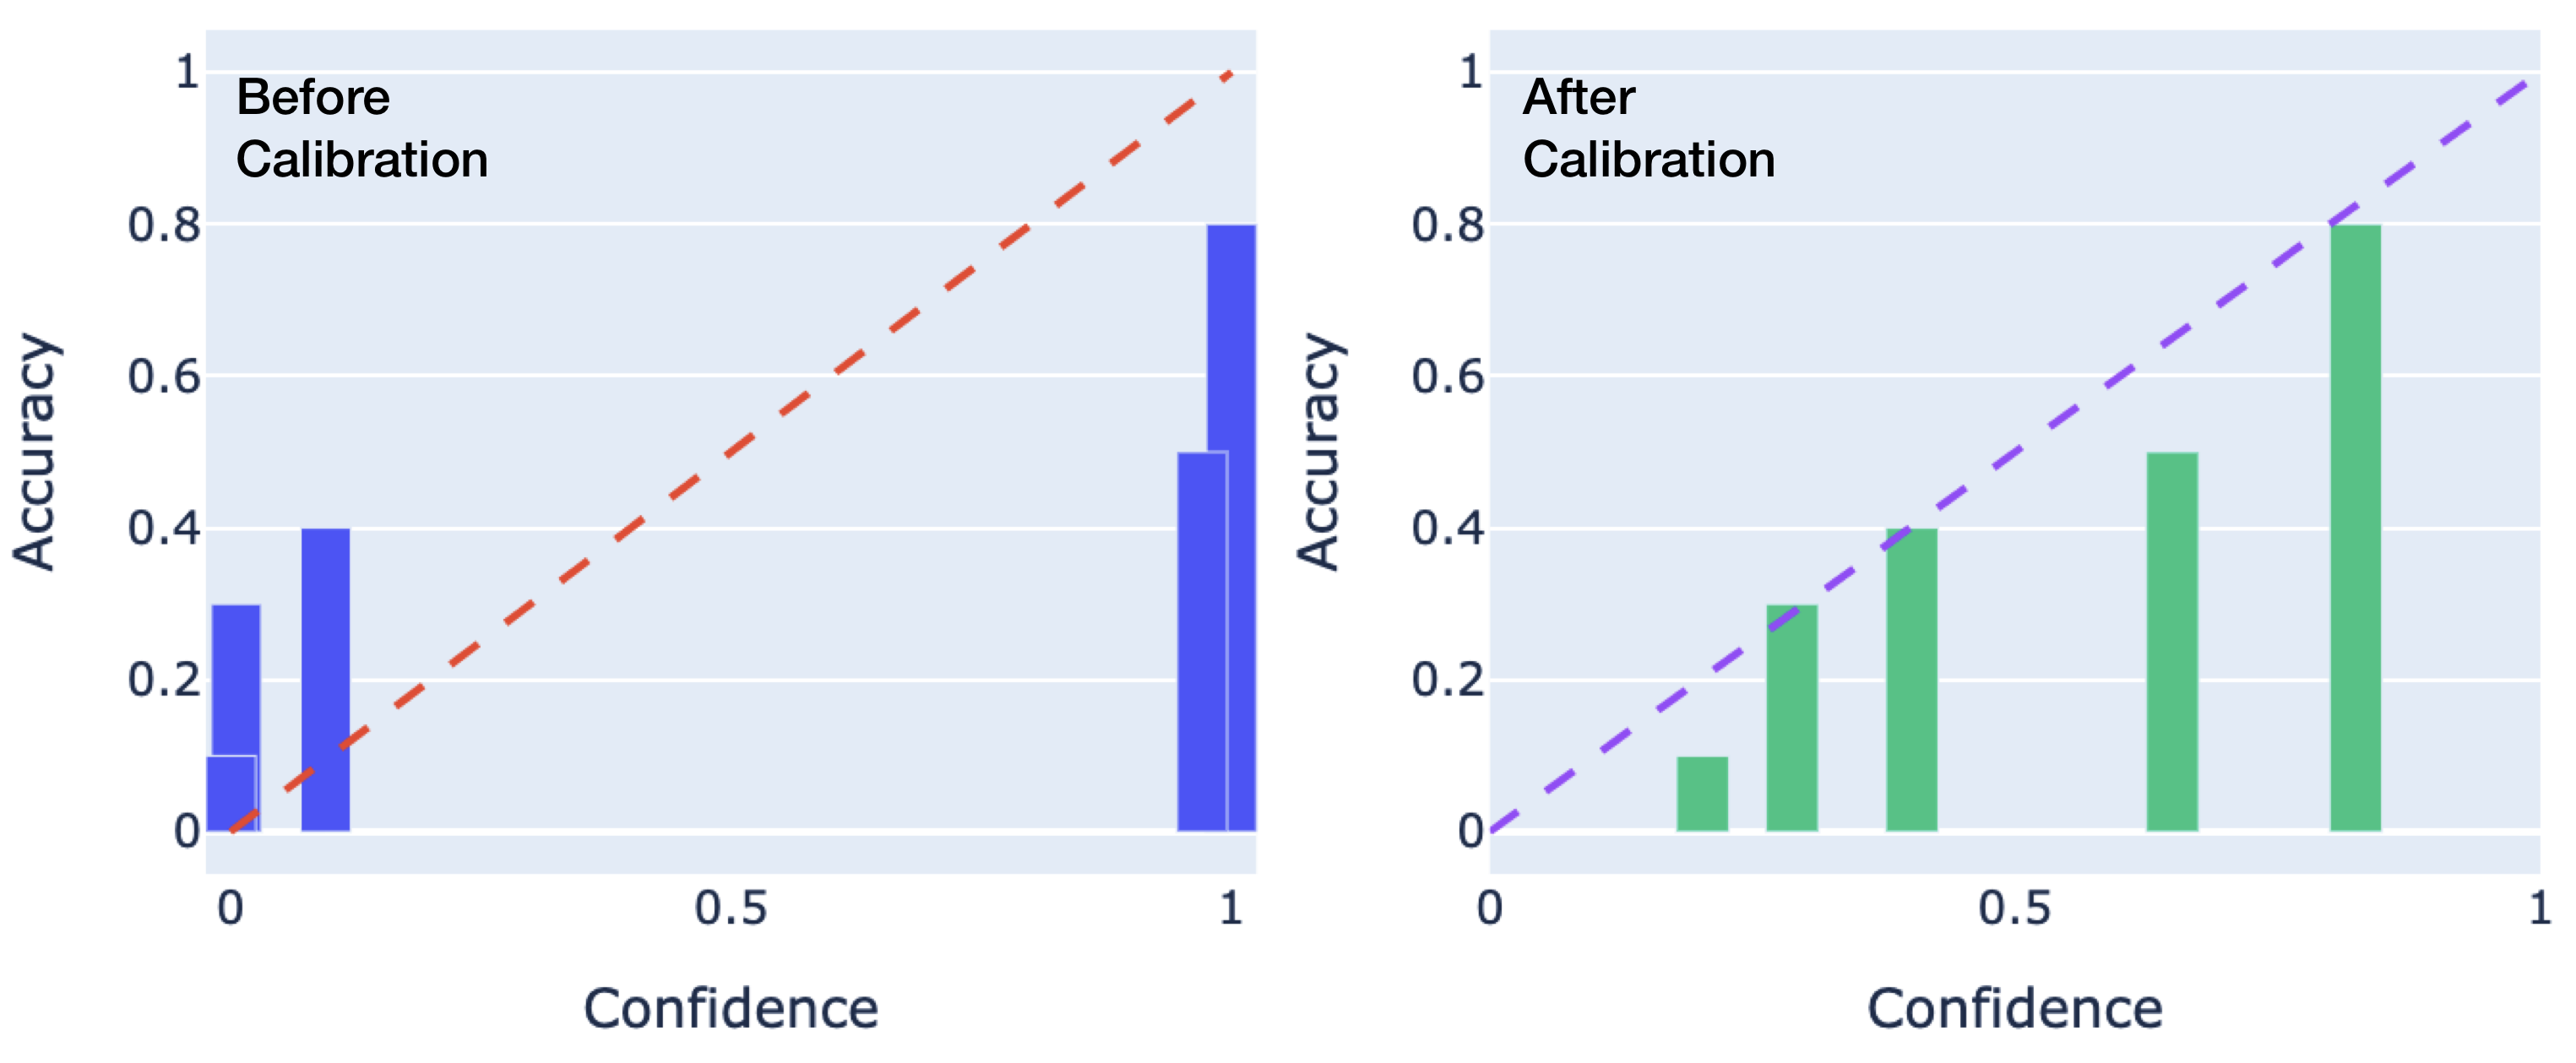
The image contains two side-by-side bar charts comparing accuracy and confidence levels before and after a calibration process. Each chart uses vertical bars to represent accuracy at specific confidence thresholds (0, 0.5, 1) and includes a dashed trend line illustrating the ideal relationship between confidence and accuracy.
### Components/Axes
- **X-Axis (Confidence)**: Labeled "Confidence," scaled from 0 to 1 in increments of 0.5.
- **Y-Axis (Accuracy)**: Labeled "Accuracy," scaled from 0 to 1 in increments of 0.2.
- **Legend**: No explicit legend is present, but colors are inferred:
- **Blue bars**: "Before Calibration" (left chart).
- **Green bars**: "After Calibration" (right chart).
- **Dashed lines**: Red (before) and purple (after), representing the ideal 1:1 relationship between confidence and accuracy.
### Detailed Analysis
#### Before Calibration (Left Chart)
- **Bars**:
- Confidence 0: Accuracy ≈ 0.1.
- Confidence 0.5: Accuracy ≈ 0.4.
- Confidence 1: Accuracy ≈ 0.8.
- **Trend Line**: Red dashed line slopes from (0,0) to (1,1), indicating the ideal scenario where accuracy equals confidence. Actual bars deviate significantly below this line except at confidence 1.
#### After Calibration (Right Chart)
- **Bars**:
- Confidence 0: Accuracy ≈ 0.1.
- Confidence 0.5: Accuracy ≈ 0.3.
- Confidence 1: Accuracy ≈ 0.8.
- **Trend Line**: Purple dashed line identical to the "Before" chart, spanning (0,0) to (1,1). Bars show improved alignment with the trend line at confidence 1 but diverge at confidence 0.5.
### Key Observations
1. **Improvement at High Confidence**: Accuracy at confidence 1 remains unchanged (0.8) before and after calibration, but the trend line suggests an ideal value of 1.0, indicating persistent underperformance.
2. **Decline at Mid-Confidence**: Accuracy at confidence 0.5 decreases from 0.4 (before) to 0.3 (after), contradicting the expectation of calibration improving performance.
3. **Baseline Consistency**: Accuracy at confidence 0 remains unchanged (0.1) in both scenarios, suggesting no improvement in low-confidence predictions.
### Interpretation
The calibration process appears to have mixed effects:
- **Positive Impact**: At high confidence (1), the system’s accuracy aligns more closely with the ideal trend line after calibration, though it still underperforms.
- **Negative Impact**: At mid-confidence (0.5), calibration reduces accuracy, raising concerns about unintended consequences or overfitting to specific confidence thresholds.
- **Baseline Limitations**: The system’s inability to improve low-confidence predictions (confidence 0) suggests fundamental limitations in the model’s foundational assumptions or data quality.
The trend lines highlight a persistent gap between ideal performance (1:1 relationship) and actual results, emphasizing the need for further refinement in calibration methodology or model architecture.