## Decision Tree: UCI Credit Data
### Overview
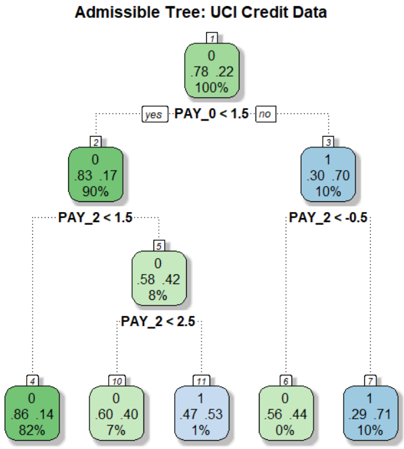
The image depicts a decision tree model, specifically an "Admissible Tree," trained on UCI credit data. The tree visually represents a series of decisions based on credit-related features (PAY_0, PAY_2) that lead to classifications. Each node in the tree shows the predicted class (0 or 1), the proportion of data belonging to each class within that node, and the percentage of total data represented by that node.
### Components/Axes
* **Title:** Admissible Tree: UCI Credit Data
* **Nodes:** Each node is represented by a rounded rectangle.
* The top of the node contains a number, presumably an ID.
* The node is split into two lines showing the proportion of class 0 and class 1.
* The bottom line shows the percentage of the total dataset represented by the node.
* **Edges:** Dotted lines connect nodes, representing decisions.
* Edges are labeled with conditions based on the PAY_0 and PAY_2 features.
* Conditions are in the form of "PAY_X < value".
* **Decisions:** "yes" and "no" labels indicate the direction of the decision based on whether the condition is met.
### Detailed Analysis
* **Node 1 (Root):**
* ID: 1
* Class 0: 0.78 (78%)
* Class 1: 0.22 (22%)
* Percentage: 100%
* **Decision 1:** PAY_0 < 1.5
* If yes, go to Node 2.
* If no, go to Node 3.
* **Node 2:**
* ID: 2
* Class 0: 0.83 (83%)
* Class 1: 0.17 (17%)
* Percentage: 90%
* **Node 3:**
* ID: 3
* Class 1: 0.30 (30%)
* Class 0: 0.70 (70%)
* Percentage: 10%
* **Decision 2 (from Node 2):** PAY_2 < 1.5
* If yes, go to Node 5.
* **Decision 3 (from Node 3):** PAY_2 < -0.5
* If yes, go to Node 6.
* If no, go to Node 7.
* **Node 5:**
* ID: 5
* Class 0: 0.58 (58%)
* Class 1: 0.42 (42%)
* Percentage: 8%
* **Decision 4 (from Node 5):** PAY_2 < 2.5
* If yes, go to Node 10.
* If no, go to Node 11.
* **Node 4:**
* ID: 4
* Class 0: 0.86 (86%)
* Class 1: 0.14 (14%)
* Percentage: 82%
* **Node 6:**
* ID: 6
* Class 0: 0.56 (56%)
* Class 1: 0.44 (44%)
* Percentage: 0%
* **Node 7:**
* ID: 7
* Class 1: 0.29 (29%)
* Class 0: 0.71 (71%)
* Percentage: 10%
* **Node 10:**
* ID: 10
* Class 0: 0.60 (60%)
* Class 1: 0.40 (40%)
* Percentage: 7%
* **Node 11:**
* ID: 11
* Class 1: 0.47 (47%)
* Class 0: 0.53 (53%)
* Percentage: 1%
* **Node 4:**
* ID: 4
* Class 0: 0.86 (86%)
* Class 1: 0.14 (14%)
* Percentage: 82%
### Key Observations
* The root node (Node 1) represents the entire dataset, with a majority (78%) belonging to class 0.
* The first split (PAY_0 < 1.5) significantly separates the data. The "yes" branch (Node 2) retains a high proportion of class 0 (83%), while the "no" branch (Node 3) has a higher proportion of class 1 (70%).
* The percentages at the bottom of each node indicate the proportion of the original dataset that falls into that node. For example, Node 4 represents 82% of the original data.
* Node 6 has a percentage of 0%, which is unusual. This could indicate a data issue or a very specific condition that is rarely met.
### Interpretation
The decision tree aims to classify credit data based on the features PAY_0 and PAY_2. The tree structure reveals how different values of these features influence the classification outcome.
* The initial split on PAY_0 < 1.5 is crucial, suggesting that this feature is a strong predictor.
* The subsequent splits on PAY_2 further refine the classification.
* The tree highlights the importance of PAY_0 and PAY_2 in predicting credit risk.
* The low percentage in Node 6 (0%) warrants further investigation, as it might indicate a problem with the data or the model.
* The model appears to be biased towards predicting class 0, as most leaf nodes have a higher proportion of class 0.