## Diagram: Admissible Tree - UCI Credit Data
### Overview
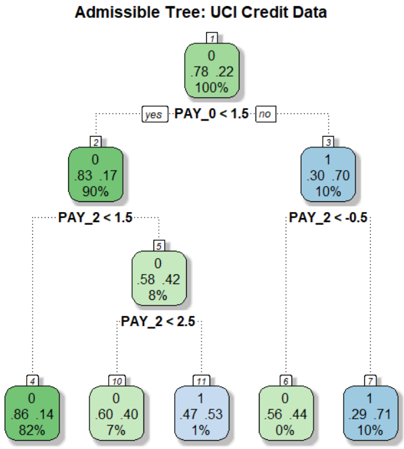
The image depicts a decision tree diagram, likely representing a classification model built on the UCI Credit Data dataset. The tree structure shows a series of binary splits based on the values of features (PAY_0, PAY_2), leading to terminal nodes representing classifications (0 or 1) along with associated probabilities and percentages.
### Components/Axes
The diagram consists of rectangular nodes connected by branches. Each node contains:
* A node ID (numbers 0-11).
* A classification (0 or 1).
* Two numerical values, likely representing a metric like Gini impurity or information gain, and a probability.
* A percentage value.
* A decision rule based on a feature and a threshold (e.g., "PAY_0 < 1.5").
The branches are labeled with "yes" or "no" indicating the outcome of the decision rule.
### Detailed Analysis or Content Details
**Node 0 (Root Node):**
* ID: 0
* Classification: 0
* Values: .78 .22
* Percentage: 100%
* Decision Rule: PAY_0 < 1.5
**Node 1 (Branch from Node 0 - "no"):**
* ID: 1
* Classification: 1
* Values: .30 .70
* Percentage: 10%
* Decision Rule: PAY_2 < -0.5
**Node 2 (Branch from Node 0 - "yes"):**
* ID: 2
* Classification: 0
* Values: .83 .17
* Percentage: 90%
* Decision Rule: PAY_2 < 1.5
**Node 3 (Branch from Node 1):**
* ID: 3
* Classification: 1
* Values: .30 .70
* Percentage: 10%
* Decision Rule: PAY_2 < -0.5
**Node 4 (Branch from Node 2 - "yes"):**
* ID: 4
* Classification: 0
* Values: .86 .14
* Percentage: 82%
**Node 5 (Branch from Node 2 - "no"):**
* ID: 5
* Classification: 0
* Values: .58 .42
* Percentage: 8%
* Decision Rule: PAY_2 < 2.5
**Node 6 (Branch from Node 1 - "yes"):**
* ID: 6
* Classification: 0
* Values: .56 .44
* Percentage: 0%
**Node 7 (Branch from Node 1 - "no"):**
* ID: 7
* Classification: 1
* Values: .29 .71
* Percentage: 10%
**Node 10 (Branch from Node 5 - "yes"):**
* ID: 10
* Classification: 0
* Values: .60 .40
* Percentage: 7%
**Node 11 (Branch from Node 5 - "no"):**
* ID: 11
* Classification: 1
* Values: .47 .53
* Percentage: 1%
### Key Observations
* The root node (Node 0) splits on PAY_0 < 1.5.
* The "no" branch from the root node (Node 1) further splits on PAY_2 < -0.5, leading to relatively low percentages (10% and 10%).
* The "yes" branch from the root node (Node 2) splits on PAY_2 < 1.5, and then on PAY_2 < 2.5.
* The terminal nodes (Nodes 4, 6, 7, 10, 11) have varying percentages, indicating different levels of confidence in the classification. Node 4 has the highest percentage (82%) of belonging to class 0.
* The percentages at the terminal nodes do not sum to 100%, suggesting that some data points may not have reached these nodes or that the tree is not fully representative of the entire dataset.
### Interpretation
This decision tree appears to be modeling credit risk based on payment history. The features PAY_0 and PAY_2 likely represent the amount of past payment defaults. The tree suggests that individuals with low values of PAY_0 (less than 1.5) are more likely to be classified as low-risk (class 0), while those with negative values of PAY_2 (less than -0.5) are more likely to be classified as high-risk (class 1).
The percentages at each node represent the proportion of data points that fall into that category. For example, at Node 4, 82% of the data points that satisfy the conditions PAY_0 < 1.5 and PAY_2 < 1.5 are classified as 0.
The tree's structure and the values within the nodes provide insights into the relationships between the features and the target variable (credit risk). The tree can be used to predict the credit risk of new individuals based on their payment history. The relatively low percentages at some terminal nodes suggest that the model may not be perfectly accurate and that further refinement or additional features may be needed to improve its performance.