## Decision Tree: UCI Credit Data Classification
### Overview
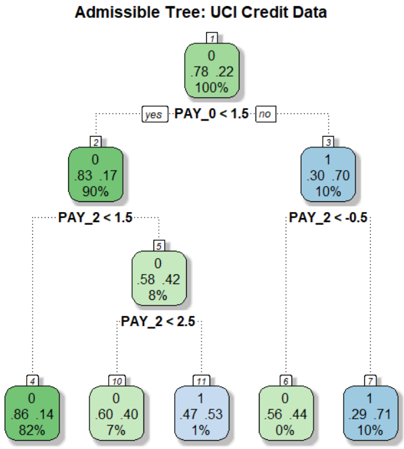
The image depicts a decision tree for classifying UCI Credit Data, with nodes representing splits based on payment history variables (PAY_0, PAY_2) and their outcomes (class 0 or 1). The tree uses color coding (green for class 0, blue for class 1) and includes numerical counts and percentages for each node.
### Components/Axes
- **Nodes**: Labeled with counts (e.g., "0", "1") and percentages (e.g., "82%", "10%").
- **Branches**: Split conditions (e.g., "PAY_0 < 1.5", "PAY_2 < 1.5").
- **Colors**:
- Green: Class 0 (non-default)
- Blue: Class 1 (default)
- **Root Node**: Labeled "7" with values "0.78", "22", and "100%".
### Detailed Analysis
1. **Root Node (7)**:
- Values: "0.78", "22", "100%" (likely representing Gini impurity, node size, and total data proportion).
- Splits into:
- **Left Branch (yes)**: PAY_0 < 1.5 → Node 2 (green, 90% class 0).
- **Right Branch (no)**: PAY_0 ≥ 1.5 → Node 3 (blue, 10% class 1).
2. **Node 2 (PAY_0 < 1.5)**:
- Splits into:
- **Left Branch (PAY_2 < 1.5)**: Node 5 (green, 8% class 0).
- **Right Branch (PAY_2 ≥ 1.5)**: Node 4 (green, 82% class 0).
3. **Node 5 (PAY_2 < 1.5)**:
- Splits into:
- **Left Branch (PAY_2 < 2.5)**: Node 10 (green, 7% class 0).
- **Right Branch (PAY_2 ≥ 2.5)**: Node 17 (blue, 1% class 0).
4. **Node 3 (PAY_0 ≥ 1.5)**:
- Splits into:
- **Left Branch (PAY_2 < -0.5)**: Node 8 (green, 0% class 0).
- **Right Branch (PAY_2 ≥ -0.5)**: Node 7 (blue, 10% class 1).
5. **Leaf Nodes**:
- **Node 4**: 86.14 instances, 82% class 0.
- **Node 8**: 56.44 instances, 0% class 0 (100% class 1).
- **Node 10**: 60.40 instances, 7% class 0.
- **Node 17**: 47.53 instances, 1% class 0.
### Key Observations
- **Class Distribution**:
- Class 0 dominates in most nodes (e.g., 82% in Node 4, 7% in Node 10).
- Class 1 is rare except in Node 8 (100% class 1) and Node 3 (10% class 1).
- **Splits**:
- PAY_0 < 1.5 leads to higher class 0 prevalence.
- PAY_2 < -0.5 results in 100% class 1 (high-risk).
- **Anomalies**:
- Node 7 appears twice (root and rightmost leaf), potentially indicating a data labeling error.
### Interpretation
The tree models credit risk by splitting on payment history variables. Nodes with higher class 1 percentages (blue) indicate higher default risk. For example:
- **PAY_2 < -0.5** (Node 8) is a strong predictor of default (100% class 1).
- **PAY_0 < 1.5** (Node 2) and **PAY_2 < 1.5** (Node 5) correlate with lower default risk (82% and 7% class 0, respectively).
- The repeated "7" label suggests a potential inconsistency in the tree structure, which may require validation.
This tree highlights how payment history variables (PAY_0, PAY_2) influence credit risk classification, with specific thresholds (e.g., PAY_2 < -0.5) serving as critical decision points.