# Technical Document Extraction: Scatter Plot Analysis
## 1. **Title & General Description**
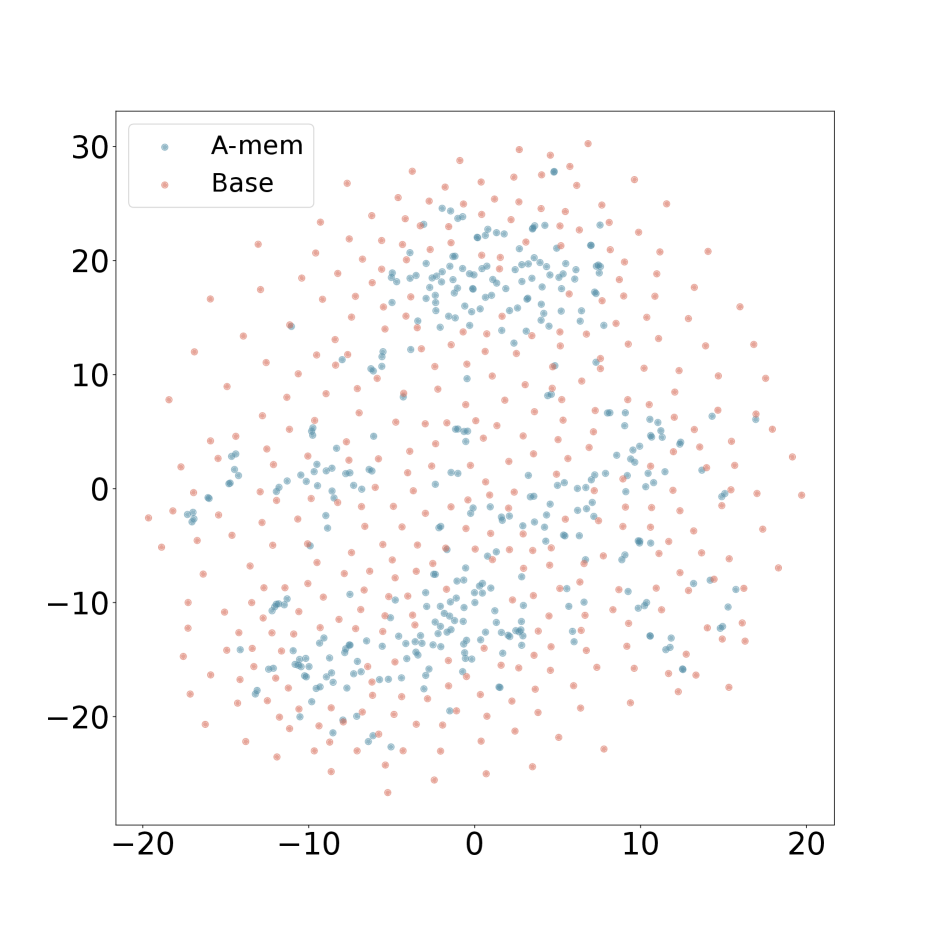
- **Title**: "Scatter Plot of A-mem and Base Data Points"
- **Type**: 2D scatter plot with two distinct data series.
- **Purpose**: Visual comparison of spatial distribution between "A-mem" and "Base" datasets.
---
## 2. **Axis Labels & Markers**
- **X-axis**:
- Range: -20 to 20 (inclusive)
- Increment: 10 units
- Labels: -20, -10, 0, 10, 20
- **Y-axis**:
- Range: -20 to 30 (inclusive)
- Increment: 10 units
- Labels: -20, -10, 0, 10, 20, 30
---
## 3. **Legend & Data Series**
- **Legend Location**: Top-left corner of the plot.
- **Data Series**:
1. **A-mem** (Blue dots):
- Spatial Distribution: Clustered around the origin (0,0) with moderate spread.
- Density: Higher concentration near the center; fewer points in extreme quadrants.
2. **Base** (Orange dots):
- Spatial Distribution: Uniformly distributed across the entire plot area.
- Density: Evenly spread with no apparent clustering.
---
## 4. **Key Observations**
- **Trend Verification**:
- **A-mem**: Central clustering suggests a potential bias toward lower magnitude values in both axes.
- **Base**: Uniform distribution indicates no systematic bias in data point placement.
- **Spatial Grounding**:
- Example A-mem point: (-5, 15) [Blue dot at x=-5, y=15].
- Example Base point: (18, -12) [Orange dot at x=18, y=-12].
- **Color Consistency**: All legend labels match their respective data point colors (blue = A-mem, orange = Base).
---
## 5. **Structural Components**
- **Header**: None (title is embedded in the plot area).
- **Main Chart**: Scatter plot occupying the majority of the image.
- **Footer**: None.
---
## 6. **Additional Notes**
- **Language**: All text is in English.
- **Missing Elements**: No data tables, embedded text, or secondary legends.
- **Visual Clarity**: High contrast between blue and orange ensures easy differentiation of series.
---
## 7. **Conclusion**
The plot reveals a clear distinction between the two datasets: A-mem exhibits central clustering, while Base shows uniform distribution. No anomalies or overlapping labels were detected.