\n
## 3D Bar Chart: L-Shaped Data Structure
### Overview
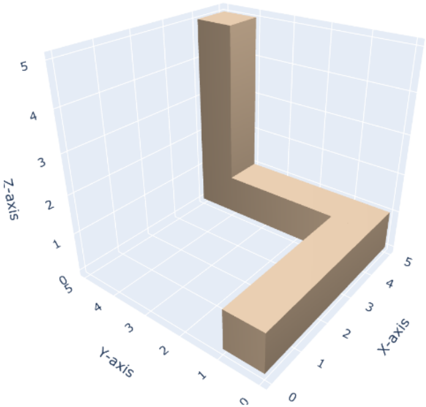
The image displays a three-dimensional bar chart rendered in an isometric perspective. The chart visualizes a simple, L-shaped structure composed of three rectangular bars positioned within a 3D coordinate system. The visualization appears to be a basic example or demonstration of 3D plotting, likely generated by a library such as Matplotlib or Plotly.
### Components/Axes
* **Coordinate System:** A 3D Cartesian coordinate system with three orthogonal axes.
* **X-axis:** Located along the bottom-right edge of the chart. It is labeled "X-axis" and has numerical markers from 0 to 5, increasing from left to right.
* **Y-axis:** Located along the bottom-left edge of the chart. It is labeled "Y-axis" and has numerical markers from 0 to 5, increasing from front to back.
* **Z-axis:** Located along the vertical left edge of the chart. It is labeled "Z-axis" and has numerical markers from 0 to 5, increasing from bottom to top.
* **Data Series:** A single data series represented by three connected bars of a uniform beige/light brown color. There is no legend, as only one data type is present.
* **Background:** A light blue grid forms the "walls" and "floor" of the 3D space, aiding in depth perception and value reading.
### Detailed Analysis
The L-shaped structure is formed by three distinct bar segments:
1. **Vertical Bar:**
* **Position:** Anchored at the origin (X=0, Y=0).
* **Dimensions:** Extends vertically along the Z-axis from Z=0 to Z=5. Its footprint on the XY-plane is a square at (0,0).
* **Trend:** This bar shows a constant, maximum value along the Z-dimension at the single point (0,0).
2. **Horizontal Bar (X-direction):**
* **Position:** Extends from the origin (X=0, Y=0) along the positive X-axis.
* **Dimensions:** Spans from X=0 to X=5. It has a constant height of Z=0 and a constant depth of Y=0.
* **Trend:** This bar represents a constant value of Z=0 across the range X=0 to X=5 at Y=0.
3. **Horizontal Bar (Y-direction):**
* **Position:** Extends from the origin (X=0, Y=0) along the positive Y-axis.
* **Dimensions:** Spans from Y=0 to Y=5. It has a constant height of Z=0 and a constant width of X=0.
* **Trend:** This bar represents a constant value of Z=0 across the range Y=0 to Y=5 at X=0.
**Spatial Grounding:** The vertical bar is positioned at the back-left corner of the plotted volume. The two horizontal bars form the base of the "L" on the XY-plane (Z=0), meeting at the origin and extending along their respective axes.
### Key Observations
* **Geometric Simplicity:** The chart does not represent a complex dataset but rather a fundamental geometric shape (an "L" or corner) in 3D space.
* **Data Sparsity:** The structure implies that data (a non-zero Z-value) exists only along the lines where X=0 or Y=0. The entire volume where both X>0 and Y>0 is empty (Z=0).
* **Visual Clarity:** The use of a single color and a clear grid makes the spatial relationships between the bars and the axes easy to discern.
* **Perspective:** The isometric view allows all three bars and their connections to be seen simultaneously without occlusion.
### Interpretation
This diagram is likely a pedagogical or technical demonstration rather than a visualization of empirical data. Its primary purpose is to illustrate how to plot 3D bar charts or to show a specific spatial configuration.
The L-shape can be interpreted as representing a system or dataset where a measured variable (Z) is only significant when one of two independent variables (X or Y) is at its minimum (zero). For example:
* It could model a scenario where a resource (Z) is consumed only at the boundaries of a process (X=0 or Y=0).
* It might represent a simple control volume or a boundary condition in a computational model.
* It serves as a clear example of how values are mapped to positions in a 3D bar chart, where the height (Z) of a bar is determined by its (X, Y) coordinates.
The absence of a descriptive title or legend reinforces its role as a generic example. The key takeaway is the visualization of discrete, axis-aligned data points in a 3D space, forming a continuous structure along the primary axes.