## Bar Chart: Mean Accuracy of Language Models
### Overview
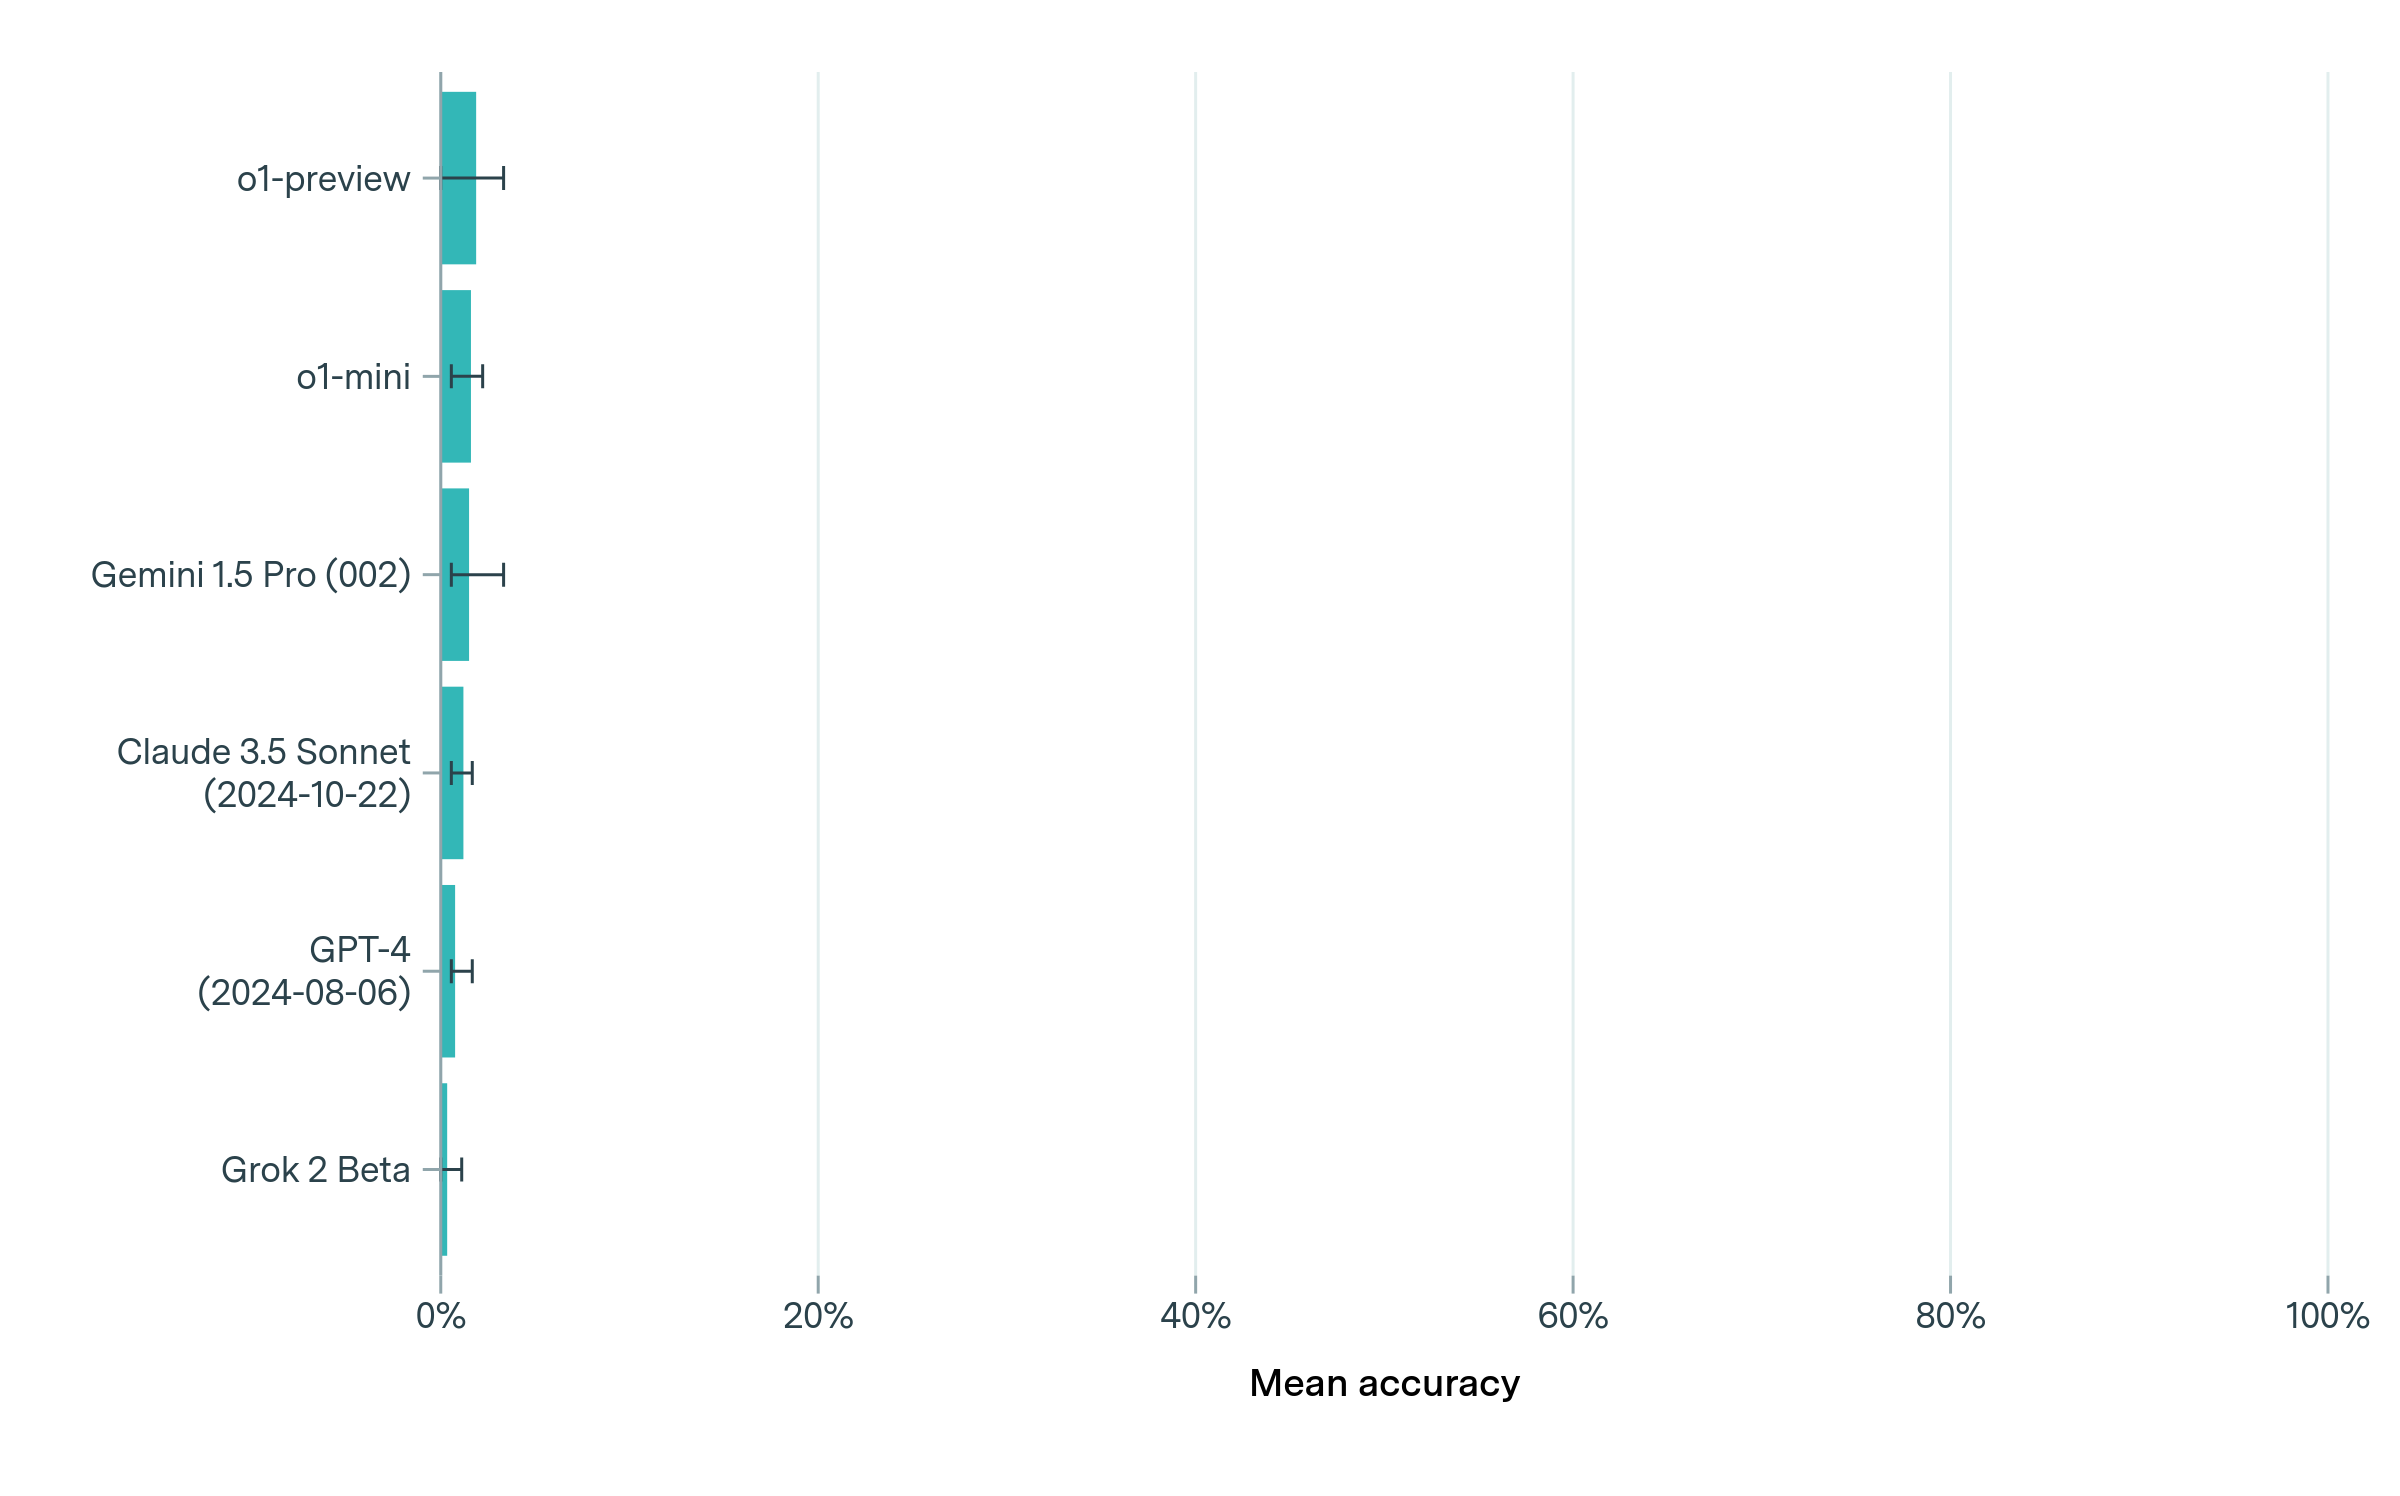
The image is a horizontal bar chart comparing the mean accuracy of several language models. The models are listed on the vertical axis, and the mean accuracy is displayed on the horizontal axis, ranging from 0% to 100%. Each bar represents the mean accuracy of a specific model, with error bars indicating the range of accuracy.
### Components/Axes
* **Vertical Axis (Language Models):**
* o1-preview
* o1-mini
* Gemini 1.5 Pro (002)
* Claude 3.5 Sonnet (2024-10-22)
* GPT-4 (2024-08-06)
* Grok 2 Beta
* **Horizontal Axis (Mean Accuracy):**
* Scale: 0% to 100%
* Markers: 0%, 20%, 40%, 60%, 80%, 100%
* **Bars:** Teal bars representing the mean accuracy for each language model.
* **Error Bars:** Black horizontal lines extending from each bar, indicating the range of accuracy.
### Detailed Analysis
Here's a breakdown of the mean accuracy for each language model, based on the bar chart:
* **o1-preview:** Mean accuracy is approximately 10%, with an error range of approximately +/- 1%.
* **o1-mini:** Mean accuracy is approximately 8%, with an error range of approximately +/- 1%.
* **Gemini 1.5 Pro (002):** Mean accuracy is approximately 7%, with an error range of approximately +/- 1%.
* **Claude 3.5 Sonnet (2024-10-22):** Mean accuracy is approximately 5%, with an error range of approximately +/- 1%.
* **GPT-4 (2024-08-06):** Mean accuracy is approximately 5%, with an error range of approximately +/- 1%.
* **Grok 2 Beta:** Mean accuracy is approximately 3%, with an error range of approximately +/- 1%.
### Key Observations
* The "o1-preview" model has the highest mean accuracy among the listed models, at approximately 10%.
* "Grok 2 Beta" has the lowest mean accuracy, at approximately 3%.
* The error ranges for all models appear to be relatively small, suggesting consistent performance.
* The models "Claude 3.5 Sonnet" and "GPT-4" have similar mean accuracy values.
### Interpretation
The bar chart provides a comparison of the mean accuracy of different language models. The data suggests that the "o1-preview" model performs better than the other models in terms of mean accuracy. The relatively small error ranges indicate that the performance of each model is consistent. The chart allows for a quick visual comparison of the models' performance, highlighting the strengths and weaknesses of each. The dates associated with some models (Claude 3.5 Sonnet and GPT-4) might indicate the version or release date of those models, which could be relevant for understanding their performance in relation to newer or older models.