\n
## Horizontal Bar Chart: Model Accuracy Comparison
### Overview
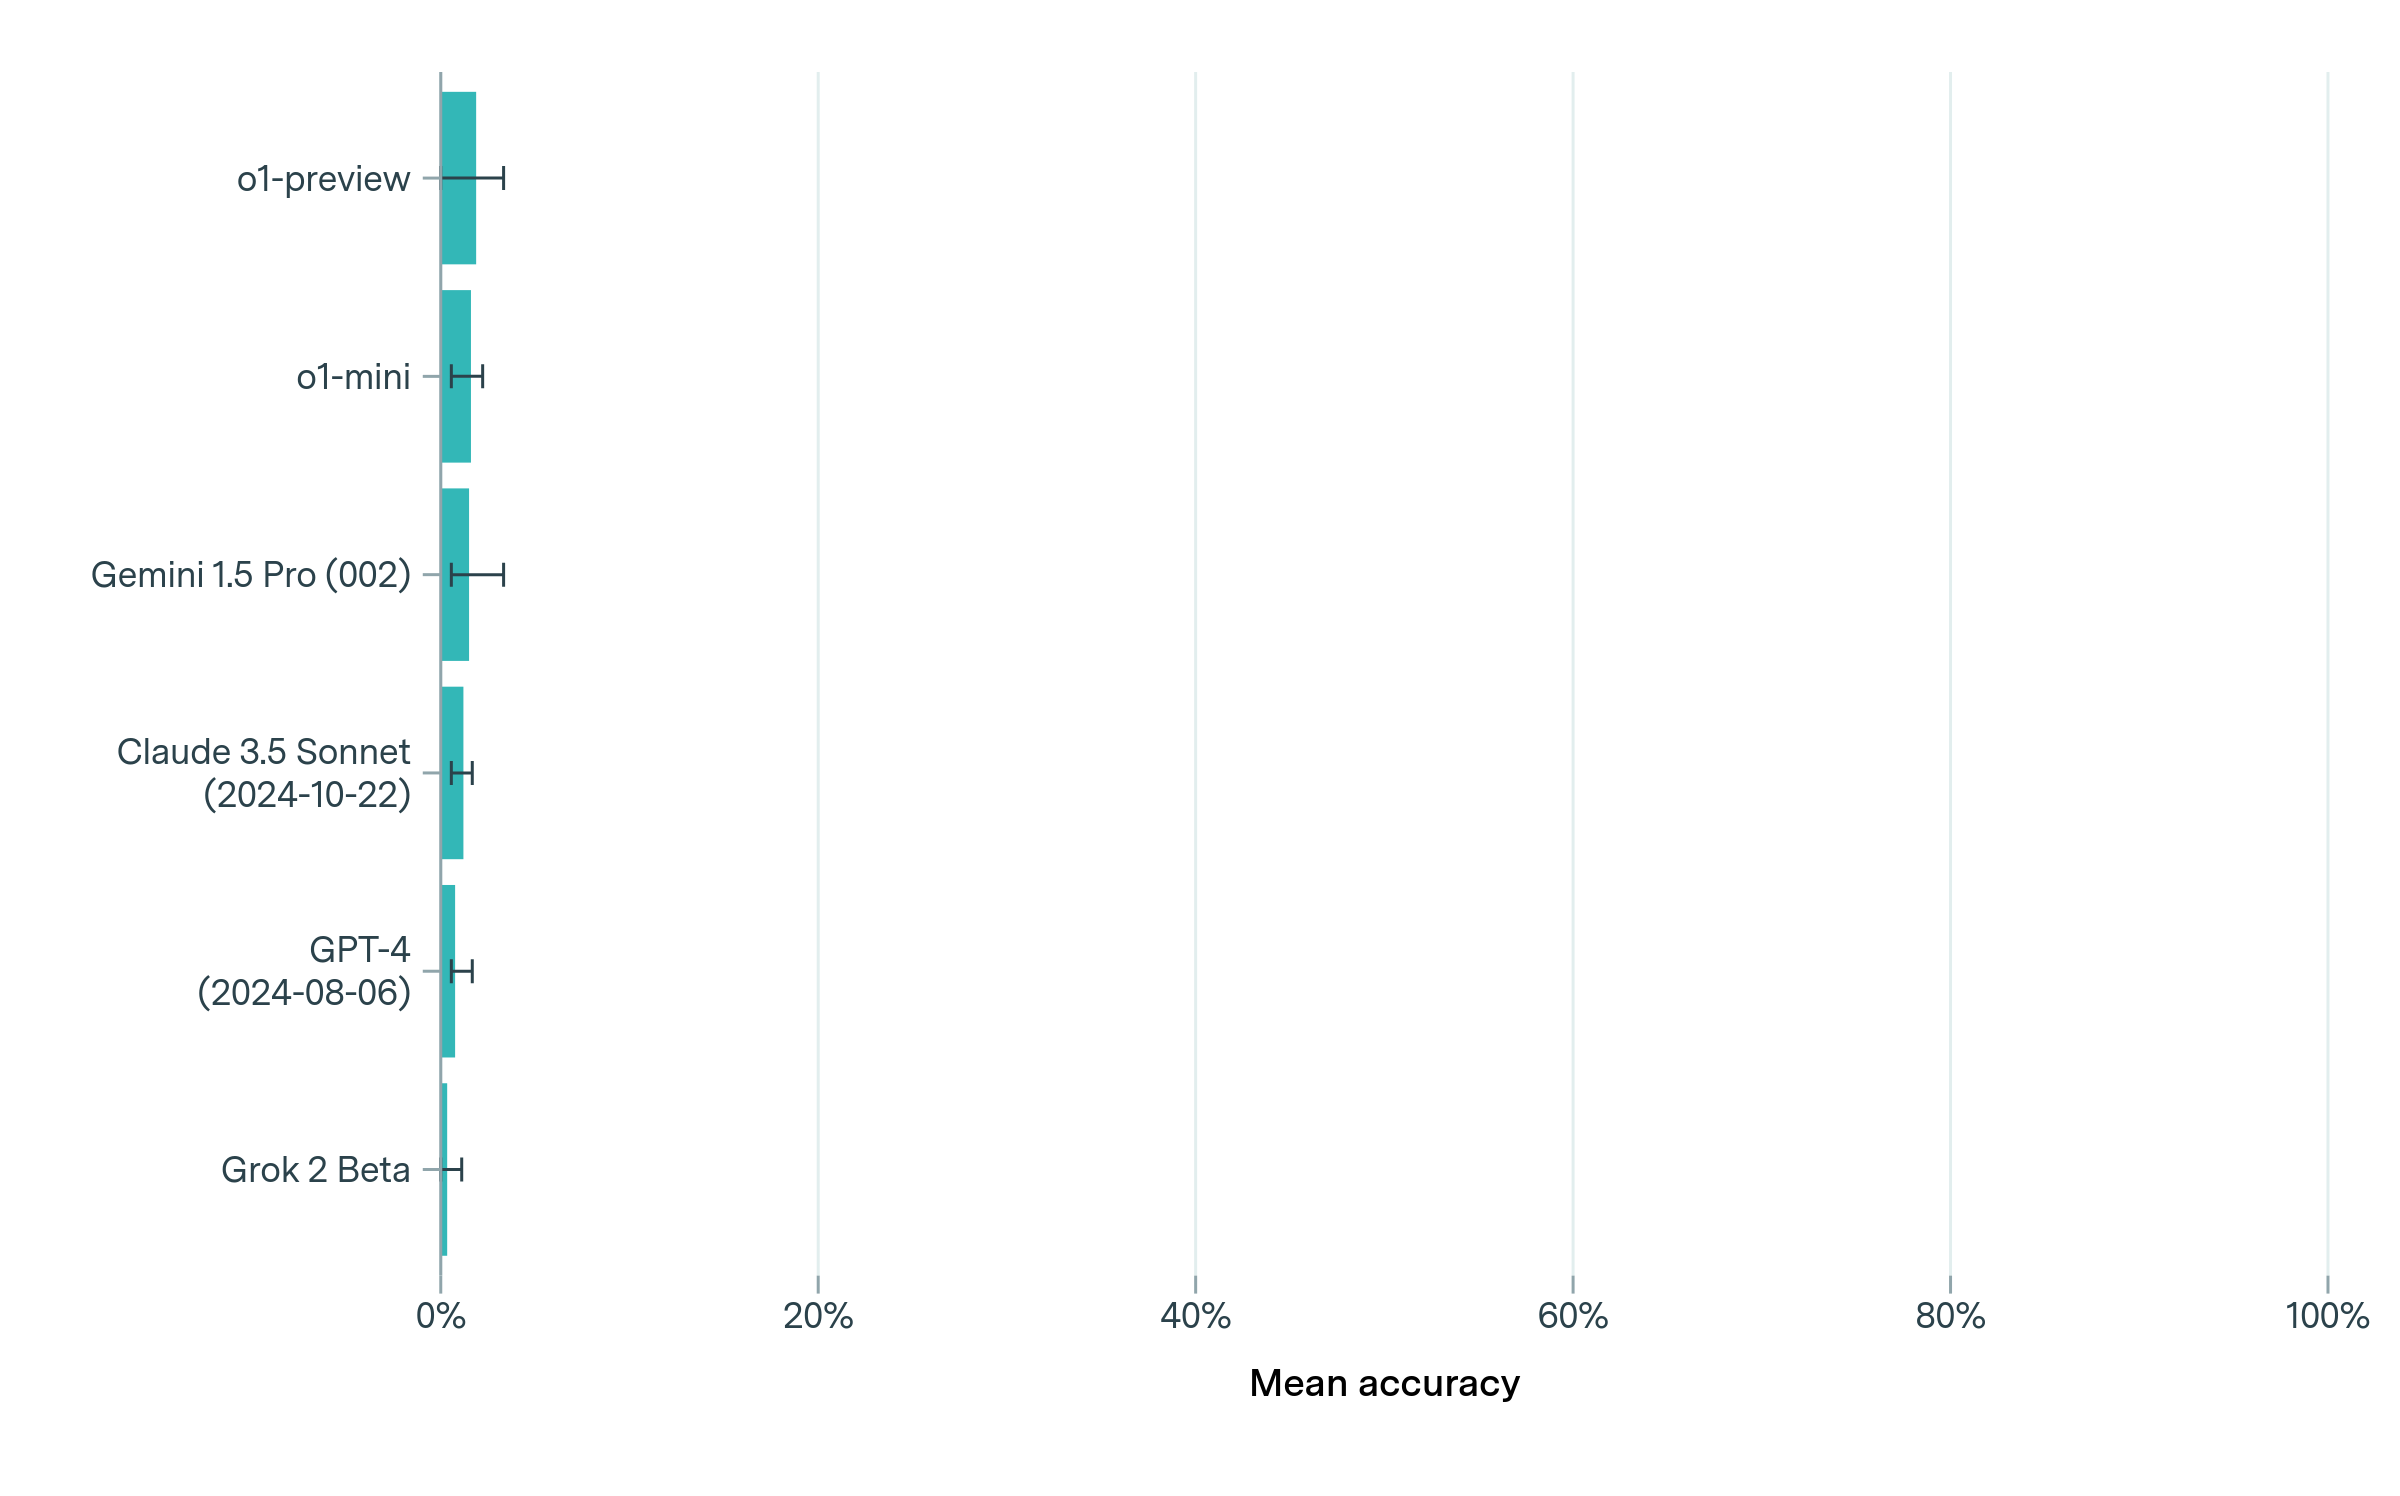
The image presents a horizontal bar chart comparing the mean accuracy of several large language models (LLMs). Each bar represents a model, and the length of the bar indicates its accuracy. Error bars are included for each model, representing the uncertainty or variance in the accuracy measurement. A light green background is present, with vertical gridlines at 20%, 40%, 60%, 80%, and 100%.
### Components/Axes
* **Y-axis:** Lists the names of the LLMs being compared: "o1-preview", "o1-mini", "Gemini 1.5 Pro (002)", "Claude 3.5 Sonnet (2024-10-22)", "GPT-4 (2024-08-06)", and "Grok 2 Beta".
* **X-axis:** Labeled "Mean accuracy", with a scale ranging from 0% to 100%, incrementing in 20% steps.
* **Bars:** Horizontal bars representing the mean accuracy of each model. All bars are the same teal color.
* **Error Bars:** Small horizontal lines extending from each bar, indicating the range of uncertainty around the mean accuracy.
### Detailed Analysis
The chart displays the following approximate accuracy values, reading from top to bottom:
* **o1-preview:** The bar extends to approximately 80% accuracy. The error bar extends from approximately 65% to 95%.
* **o1-mini:** The bar extends to approximately 60% accuracy. The error bar extends from approximately 45% to 75%.
* **Gemini 1.5 Pro (002):** The bar extends to approximately 50% accuracy. The error bar extends from approximately 35% to 65%.
* **Claude 3.5 Sonnet (2024-10-22):** The bar extends to approximately 45% accuracy. The error bar extends from approximately 30% to 60%.
* **GPT-4 (2024-08-06):** The bar extends to approximately 30% accuracy. The error bar extends from approximately 15% to 45%.
* **Grok 2 Beta:** The bar extends to approximately 20% accuracy. The error bar extends from approximately 5% to 35%.
The bars are arranged in descending order of mean accuracy, with "o1-preview" at the top and "Grok 2 Beta" at the bottom.
### Key Observations
* "o1-preview" exhibits the highest mean accuracy, significantly outperforming the other models.
* "Grok 2 Beta" has the lowest mean accuracy.
* The error bars indicate varying degrees of uncertainty in the accuracy measurements. "o1-preview" has a relatively wide error bar, suggesting greater variability in its performance.
* The dates in parentheses next to "Claude 3.5 Sonnet" and "GPT-4" indicate the date the model was evaluated.
### Interpretation
This chart demonstrates a clear ranking of the LLMs based on their mean accuracy on a specific task or dataset. The substantial difference in accuracy between "o1-preview" and the other models suggests it is a significantly more capable model. The error bars are crucial for understanding the reliability of these results; a wider error bar implies that the reported accuracy might not be consistently achieved. The inclusion of evaluation dates for "Claude 3.5 Sonnet" and "GPT-4" suggests that model performance can change over time, and these results are specific to the dates indicated. The chart provides a valuable comparative assessment of these LLMs, but it's important to consider the context of the evaluation (e.g., the specific task, dataset, and evaluation metrics) to fully interpret the results. The light green background does not appear to have any data-related significance, and is likely for aesthetic purposes.