## Horizontal Bar Chart: Model Mean Accuracy Comparison
### Overview
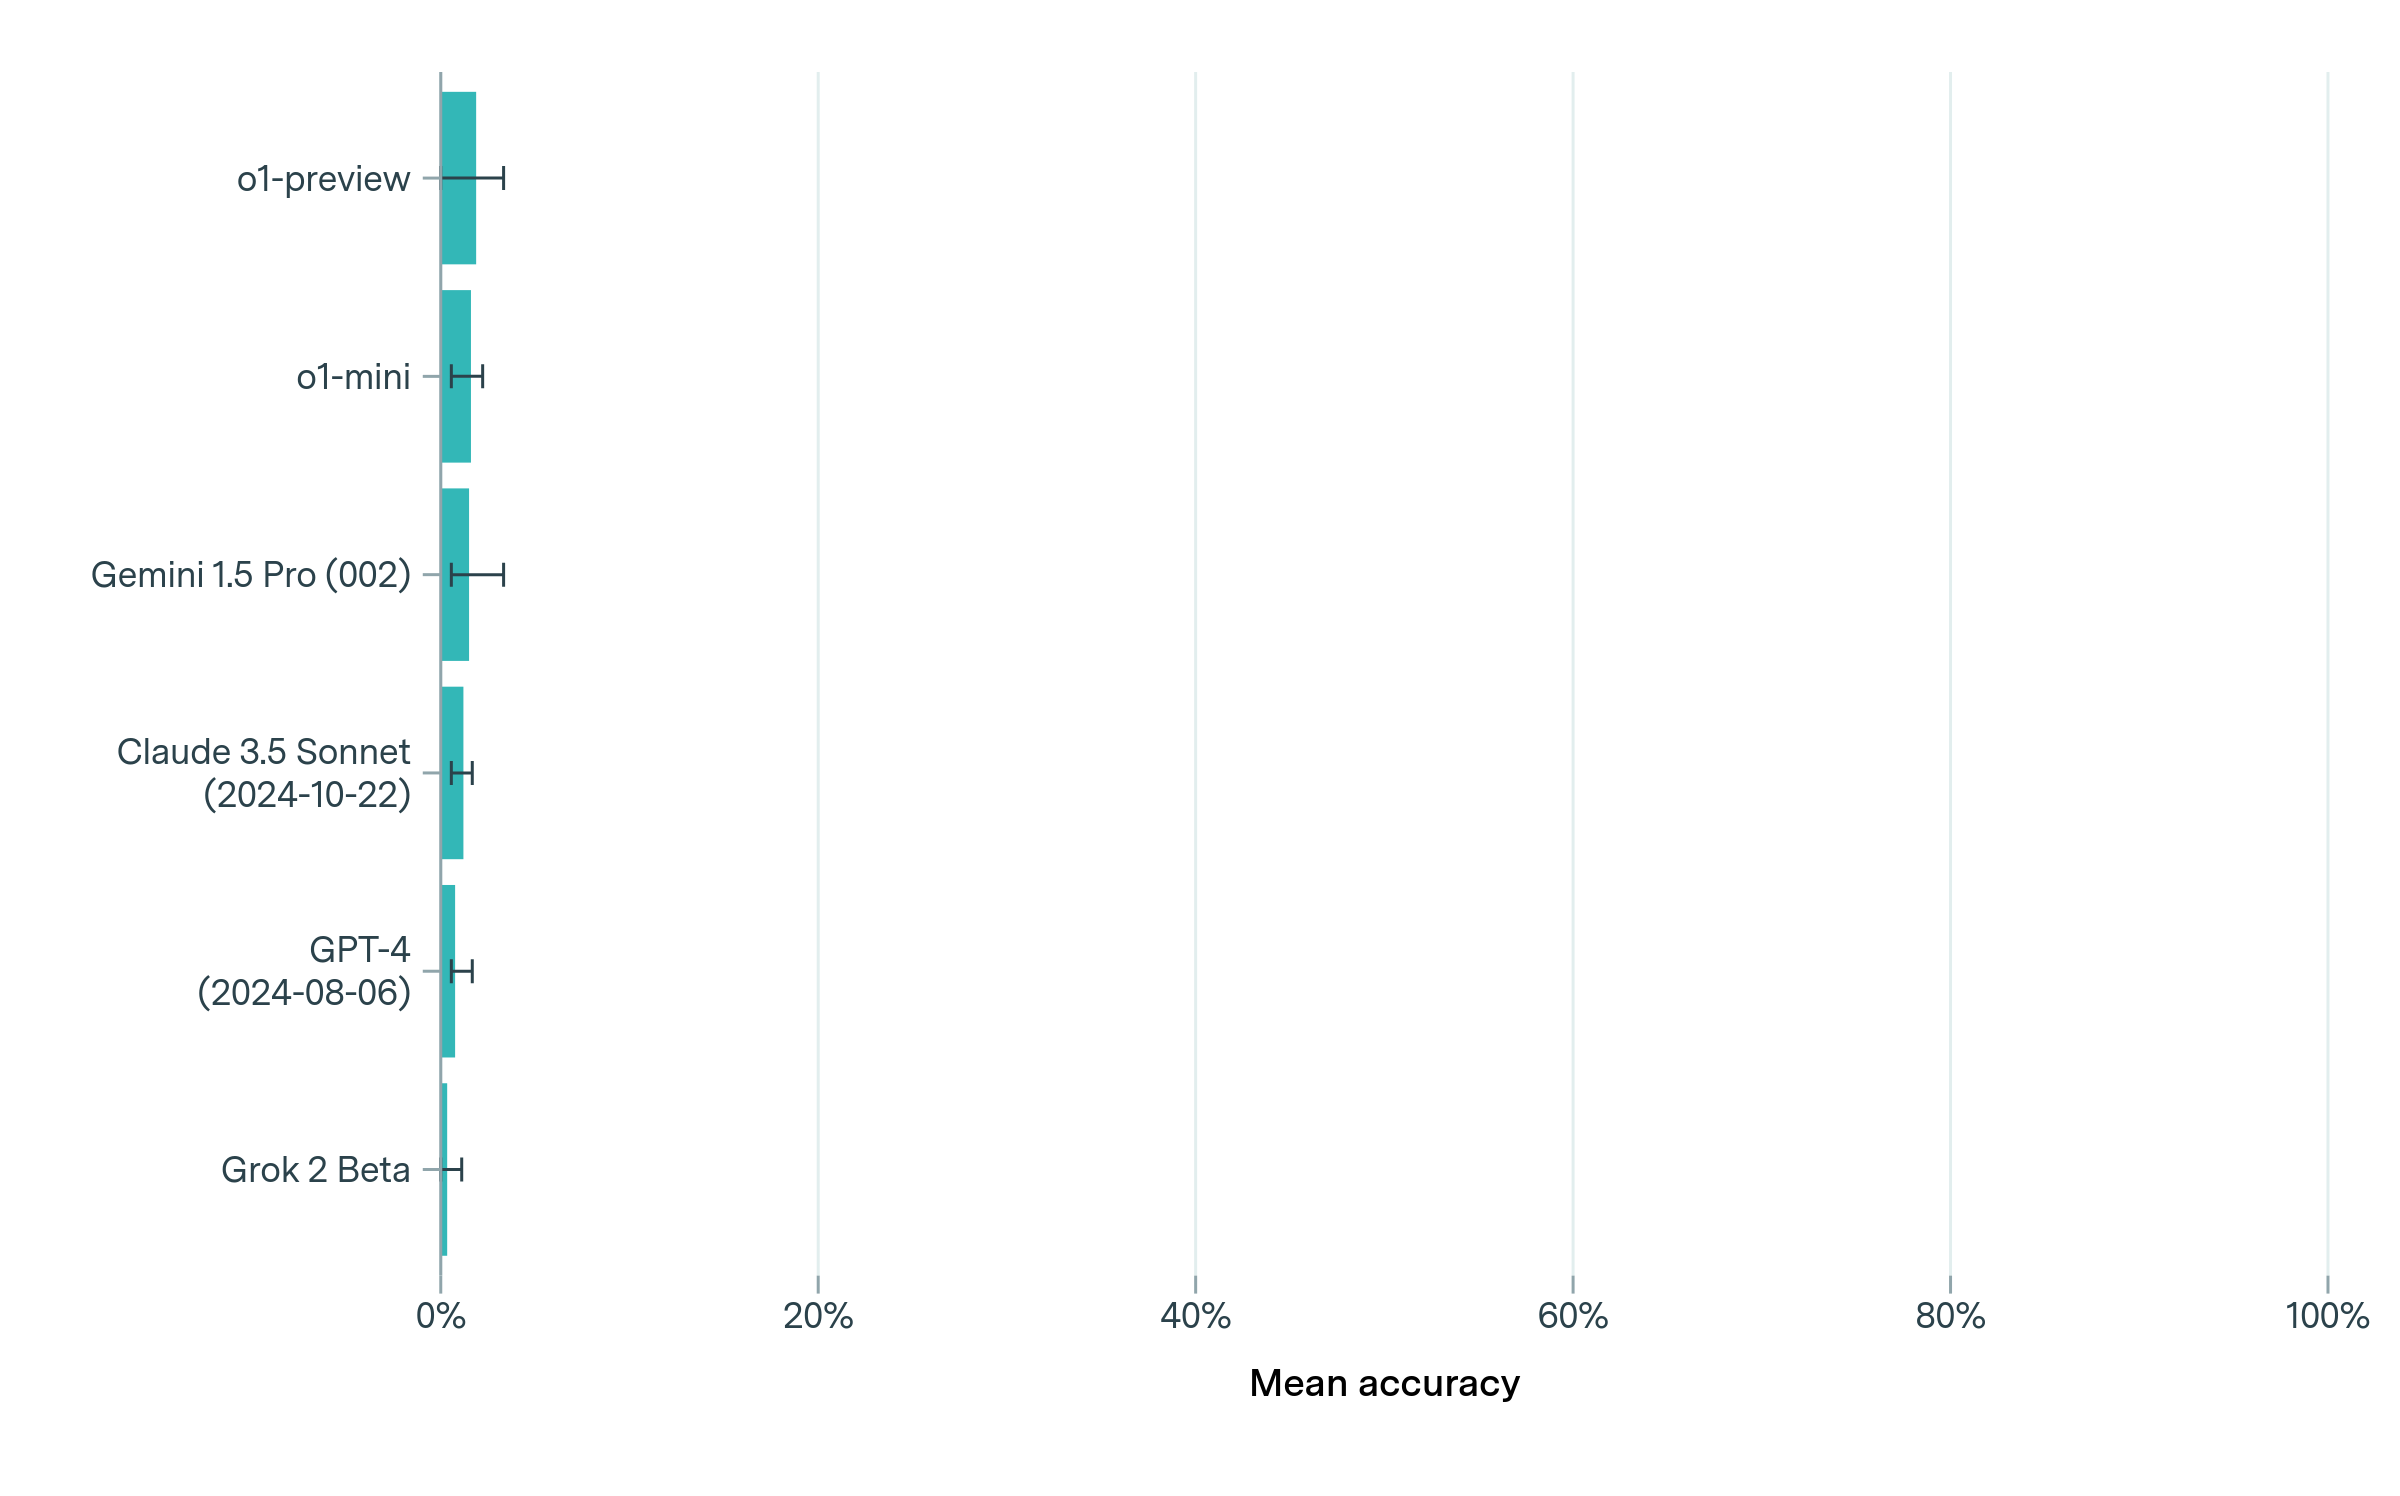
The image displays a horizontal bar chart comparing the mean accuracy of six AI models or versions. All bars are clustered near 0% on the x-axis, with small error bars indicating variability. The y-axis lists model names with version/date annotations, while the x-axis is labeled "Mean accuracy" with a 0%-100% scale.
### Components/Axes
- **Y-Axis (Categories)**:
- o1-preview
- o1-mini
- Gemini 1.5 Pro (002)
- Claude 3.5 Sonnet (2024-10-22)
- GPT-4 (2024-08-06)
- Grok 2 Beta
- **X-Axis (Mean Accuracy)**:
- Scale: 0% to 100% (linear)
- Label: "Mean accuracy"
- **Bars**:
- Color: Teal (#008080)
- Error bars: Small vertical lines at both ends of each bar
- **Legend**: Not explicitly present; all bars share the same teal color.
### Detailed Analysis
1. **o1-preview**:
- Bar length: ~2% (approximate)
- Error bar: ±0.5% (estimated)
2. **o1-mini**:
- Bar length: ~1.5%
- Error bar: ±0.3%
3. **Gemini 1.5 Pro (002)**:
- Bar length: ~1.2%
- Error bar: ±0.4%
4. **Claude 3.5 Sonnet (2024-10-22)**:
- Bar length: ~0.8%
- Error bar: ±0.2%
5. **GPT-4 (2024-08-06)**:
- Bar length: ~0.5%
- Error bar: ±0.1%
6. **Grok 2 Beta**:
- Bar length: ~0.2%
- Error bar: ±0.1%
### Key Observations
- All models exhibit mean accuracies **near 0%**, with no model exceeding ~2%.
- Error bars are smallest for Grok 2 Beta and GPT-4, suggesting higher measurement precision for these.
- Newer models (e.g., Claude 3.5 Sonnet, GPT-4) do not show higher accuracy than older versions (e.g., o1-preview).
- The chart lacks a title or contextual labels, making the evaluation task unclear.
### Interpretation
The data suggests that all tested models perform poorly on the evaluated task, with accuracies clustered near 0%. The small error bars indicate consistent but low performance across models. The inclusion of version/date annotations implies potential versioning or release timelines, but no clear correlation between recency and accuracy is evident. This could reflect:
1. A highly challenging or niche evaluation task.
2. Data visualization errors (e.g., miscalibrated axes).
3. Intentional demonstration of model limitations for comparative analysis.
The absence of a legend or task description limits interpretability, but the uniformity of low accuracies across models is the dominant trend.