## Bar Chart: Percentage of Reflections by Model and Dataset
### Overview
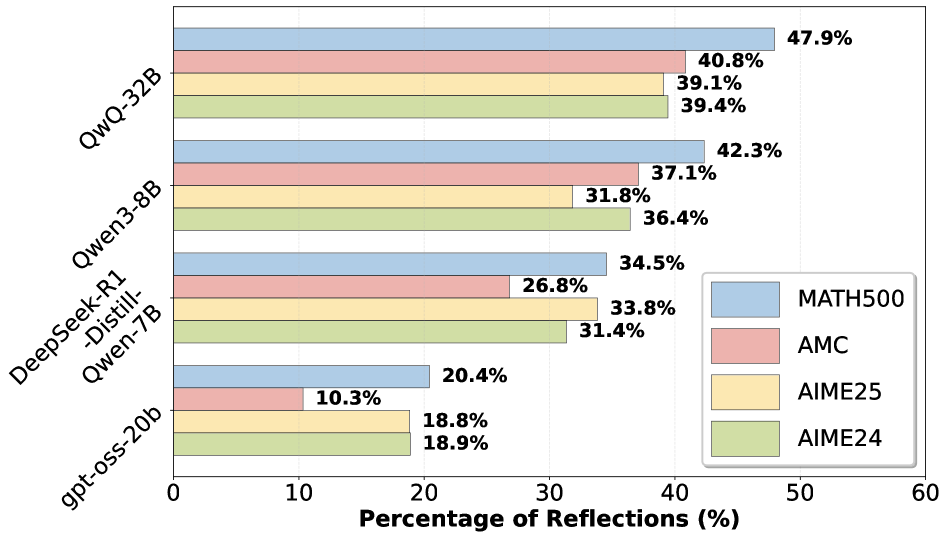
The chart compares the percentage of reflections across four AI models (QwQ-32B, Qwen3-8B, DeepSeek-R1-Distill-Qwen-7B, gpt-oss-20b) for four datasets (MATH500, AMC, AIME25, AIME24). Each model is represented by a grouped bar cluster, with colors corresponding to datasets as defined in the legend.
### Components/Axes
- **X-axis**: "Percentage of Reflections (%)" (0–60% scale)
- **Y-axis**: Model names (QwQ-32B at top, gpt-oss-20b at bottom)
- **Legend**:
- Blue = MATH500
- Red = AMC
- Orange = AIME25
- Green = AIME24
- **Bar Colors**: Match legend labels (e.g., QwQ-32B's MATH500 bar is blue).
### Detailed Analysis
1. **QwQ-32B**:
- MATH500: 47.9% (blue)
- AMC: 40.8% (red)
- AIME25: 39.1% (orange)
- AIME24: 39.4% (green)
2. **Qwen3-8B**:
- MATH500: 42.3% (blue)
- AMC: 37.1% (red)
- AIME25: 31.8% (orange)
- AIME24: 36.4% (green)
3. **DeepSeek-R1-Distill-Qwen-7B**:
- MATH500: 34.5% (blue)
- AMC: 26.8% (red)
- AIME25: 33.8% (orange)
- AIME24: 31.4% (green)
4. **gpt-oss-20b**:
- MATH500: 20.4% (blue)
- AMC: 10.3% (red)
- AIME25: 18.8% (orange)
- AIME24: 18.9% (green)
### Key Observations
- **MATH500** consistently shows the highest reflection percentages across all models, with QwQ-32B achieving the peak at 47.9%.
- **AMC** performance declines sharply for smaller models (e.g., gpt-oss-20b at 10.3%).
- **AIME25** and **AIME24** exhibit similar trends, with AIME25 slightly outperforming AIME24 in most cases (e.g., Qwen3-8B: 31.8% vs. 36.4%).
- **gpt-oss-20b** underperforms across all datasets, with the lowest reflection rates (18.8–20.4%).
### Interpretation
The data suggests that **MATH500** is the most effective dataset for reflection tasks, as it consistently yields the highest percentages. Larger models like **QwQ-32B** and **Qwen3-8B** outperform smaller models like **gpt-oss-20b**, indicating a correlation between model size and reflection capability. The near-identical AIME25/AIME24 results for some models (e.g., Qwen3-8B) imply minimal differentiation between these datasets in this context. The steep drop in AMC performance for smaller models highlights potential limitations in handling complex reasoning tasks. These trends align with expectations that larger, more specialized models excel in structured problem-solving benchmarks.