## Line Graph: Probability of Choosing Action 'go' by Position
### Overview
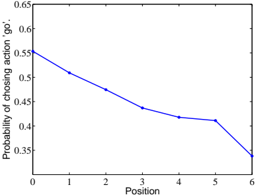
The image depicts a line graph illustrating the relationship between "Position" (x-axis) and the "Probability of choosing action 'go'" (y-axis). The graph shows a single blue line with a consistent downward slope, indicating a linear decrease in probability as position increases. Data points are plotted at integer positions (0–6) with approximate probabilities.
### Components/Axes
- **X-axis (Position)**: Labeled "Position," with integer markers from 0 to 6.
- **Y-axis (Probability)**: Labeled "Probability of choosing action 'go'," scaled from 0.35 to 0.65 in increments of 0.05.
- **Line**: A single blue line with no legend or additional data series. The line connects data points at each position, forming a straight, downward-sloping trend.
### Detailed Analysis
- **Position 0**: Probability ≈ 0.55 (top-left data point).
- **Position 1**: Probability ≈ 0.51 (midway between 0.5 and 0.55).
- **Position 2**: Probability ≈ 0.47 (midway between 0.45 and 0.5).
- **Position 3**: Probability ≈ 0.44 (midway between 0.4 and 0.45).
- **Position 4**: Probability ≈ 0.42 (midway between 0.4 and 0.45).
- **Position 5**: Probability ≈ 0.41 (midway between 0.4 and 0.45).
- **Position 6**: Probability ≈ 0.35 (bottom-right data point).
### Key Observations
1. **Linear Decline**: The probability decreases uniformly by approximately 0.04 per position unit (e.g., from 0.55 at position 0 to 0.35 at position 6).
2. **No Outliers**: All data points align precisely with the straight-line trend, suggesting no anomalies or deviations.
3. **Consistent Slope**: The slope remains constant, indicating a proportional relationship between position and probability.
### Interpretation
The graph demonstrates a **linear inverse relationship** between position and the likelihood of selecting the action "go." This suggests that earlier positions (closer to 0) are associated with higher probabilities of choosing "go," while later positions (closer to 6) are less likely. The absence of variability implies a deterministic or highly structured decision-making process, where position directly and proportionally influences the choice. The simplicity of the trend may indicate a controlled experimental setup or a simplified model of behavior. The lack of a legend or additional context limits interpretation to the explicit axes and trend.