\n
## Line Chart: Probability of Choosing Action 'go' vs. Position
### Overview
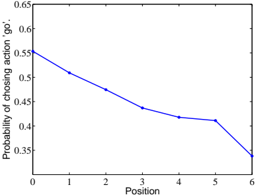
The image presents a line chart illustrating the relationship between the position (x-axis) and the probability of choosing the action 'go' (y-axis). The chart shows a decreasing trend, indicating that the probability of choosing 'go' diminishes as the position increases.
### Components/Axes
* **X-axis:** Labeled "Position", ranging from 0 to 6. The axis has tick marks at integer values.
* **Y-axis:** Labeled "Probability of choosing action 'go'", ranging from 0.3 to 0.65. The axis has tick marks at intervals of 0.05.
* **Data Series:** A single blue line representing the probability of choosing 'go' at different positions.
* **Background:** White.
* **Gridlines:** Faint gray horizontal and vertical gridlines.
### Detailed Analysis
The blue line starts at approximately (0, 0.55) and generally slopes downward as the position increases. Here's a breakdown of approximate data points:
* (0, 0.55)
* (1, 0.52)
* (2, 0.48)
* (3, 0.44)
* (4, 0.42)
* (5, 0.41)
* (6, 0.34)
The line exhibits a steeper decline between positions 4 and 6. The trend is consistently decreasing, but the rate of decrease varies.
### Key Observations
* The probability of choosing 'go' is highest at position 0.
* The probability decreases steadily with increasing position.
* The most significant drop in probability occurs between positions 5 and 6.
### Interpretation
The chart suggests a negative correlation between position and the likelihood of choosing the action 'go'. This could indicate a strategic element where the desirability of 'go' decreases as one progresses through a sequence of positions. The steeper decline at the end suggests a critical threshold or a change in conditions at higher positions. Without further context, it's difficult to determine the specific meaning of "position" and "go", but the data clearly demonstrates a diminishing preference for the 'go' action as position increases. This could represent a decision-making process where the initial inclination to act diminishes over time or distance. The data could also be modeling a decay function, where the probability of an event decreases exponentially with position.