## Diagram: LLM Explainability Barrier
### Overview
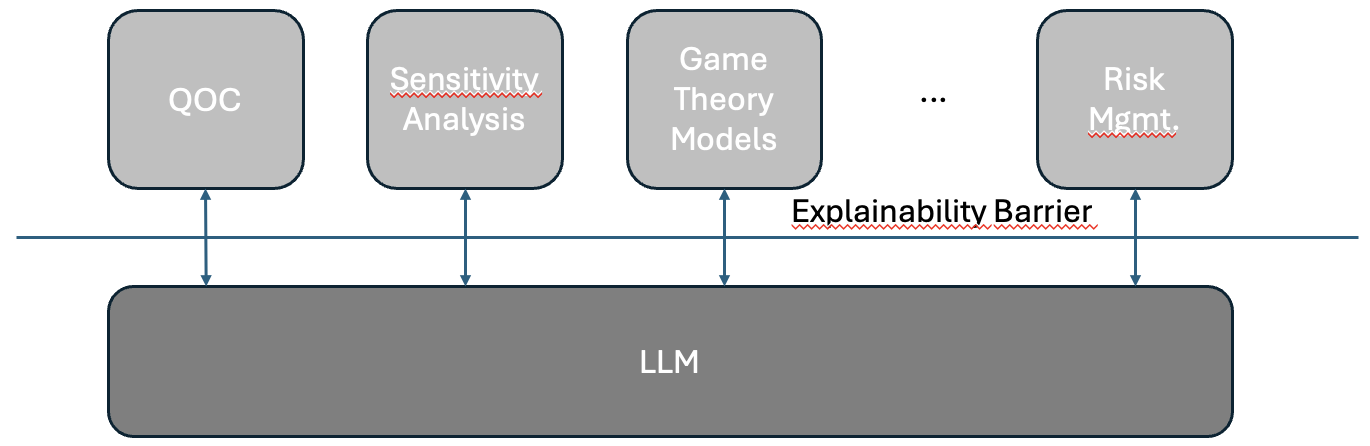
The image is a diagram illustrating the concept of an "Explainability Barrier" in the context of Large Language Models (LLMs). It shows various components like QOC, Sensitivity Analysis, Game Theory Models, and Risk Management interacting with an LLM, with the "Explainability Barrier" separating them.
### Components/Axes
* **Top Row (Left to Right):**
* Rounded rectangle labeled "QOC"
* Rounded rectangle labeled "Sensitivity Analysis"
* Rounded rectangle labeled "Game Theory Models"
* Ellipsis "..." indicating more components
* Rounded rectangle labeled "Risk Mgmt."
* **Horizontal Line:** A solid blue line spanning the width of the diagram, labeled "Explainability Barrier" with a red wavy line underneath.
* **Bottom:**
* A large rounded rectangle labeled "LLM"
### Detailed Analysis
* **QOC:** A gray rounded rectangle at the top-left. A blue arrow points downwards from the bottom of the rectangle to the top of the "LLM" rectangle.
* **Sensitivity Analysis:** A gray rounded rectangle to the right of "QOC". A blue arrow points downwards from the bottom of the rectangle to the top of the "LLM" rectangle. The word "Sensitivity" has a red wavy line underneath it.
* **Game Theory Models:** A gray rounded rectangle to the right of "Sensitivity Analysis". A blue arrow points downwards from the bottom of the rectangle to the top of the "LLM" rectangle.
* **Ellipsis:** An ellipsis "..." indicates that there are more components between "Game Theory Models" and "Risk Mgmt.".
* **Risk Mgmt.:** A gray rounded rectangle at the top-right. A blue arrow points downwards from the bottom of the rectangle to the top of the "LLM" rectangle. The word "Mgmt." has a red wavy line underneath it.
* **Explainability Barrier:** A solid blue horizontal line runs across the diagram, separating the top row of components from the "LLM" at the bottom. The text "Explainability Barrier" is positioned above this line, with a red wavy line underneath it.
* **LLM:** A large gray rounded rectangle at the bottom of the diagram.
### Key Observations
* The diagram illustrates a separation between various components (QOC, Sensitivity Analysis, etc.) and the LLM.
* The "Explainability Barrier" acts as a conceptual divide, suggesting difficulty in understanding or interpreting the LLM's processes or outputs in relation to these components.
* The arrows indicate a flow or interaction from the components down to the LLM.
### Interpretation
The diagram represents the challenge of explainability in Large Language Models. The "Explainability Barrier" suggests that while various components (like QOC, Sensitivity Analysis, etc.) interact with the LLM, understanding *how* the LLM processes and uses the information from these components is difficult. The red wavy lines under certain words may indicate areas of particular concern or emphasis related to explainability. The diagram highlights the need for methods and techniques to bridge this gap and make LLMs more transparent and understandable.