\n
## Diagram: LLM Integration with Analytical Methods
### Overview
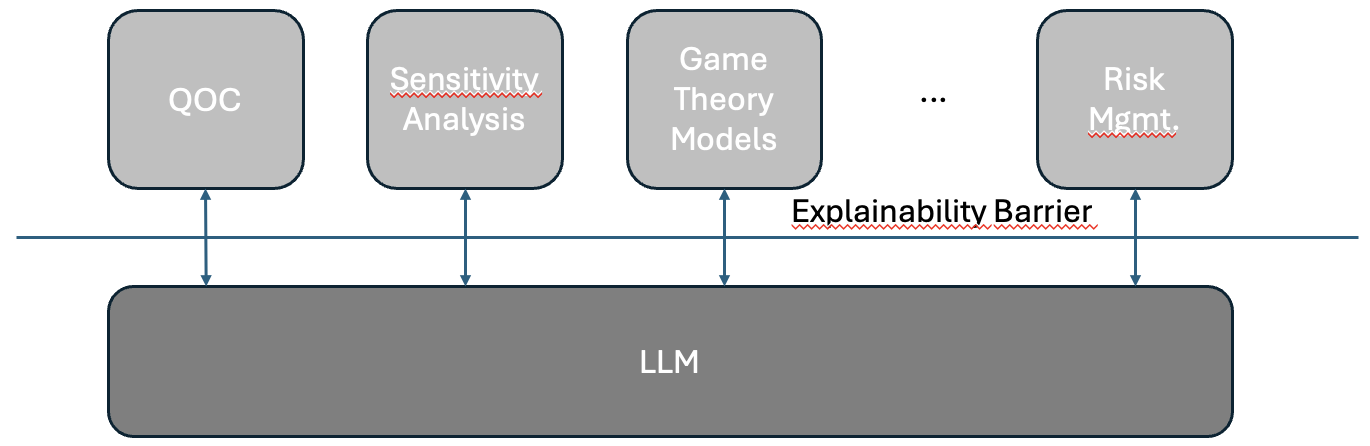
The image is a diagram illustrating the integration of various analytical methods with a Large Language Model (LLM). It depicts several analytical techniques positioned above an LLM, separated by a visual barrier labeled "Explainability Barrier." The diagram suggests a challenge in directly connecting these methods to the LLM due to explainability concerns.
### Components/Axes
The diagram consists of the following components:
* **LLM:** A large, dark gray rectangular block at the bottom of the image, labeled "LLM".
* **Analytical Methods:** Four rounded rectangular blocks positioned above the LLM, labeled:
* "QOC" (Quality Control)
* "Sensitivity Analysis"
* "Game Theory Models"
* "Risk Mgmt." (Risk Management)
* **Explainability Barrier:** A light blue wavy line separating the analytical methods from the LLM, labeled "Explainability Barrier".
* **Ellipsis:** "..." indicating that there are other analytical methods not explicitly shown.
* **Arrows:** Downward-pointing arrows connecting each analytical method to the LLM, indicating a potential flow of information or interaction.
### Detailed Analysis or Content Details
The diagram does not contain numerical data. It is a conceptual representation of a system architecture. The arrangement suggests that each analytical method could potentially interface with the LLM, but is hindered by the "Explainability Barrier." The ellipsis indicates that the list of analytical methods is not exhaustive.
### Key Observations
The central theme of the diagram is the challenge of explainability when integrating complex analytical methods with an LLM. The barrier visually emphasizes this difficulty. The choice of analytical methods suggests a focus on quantitative and model-based approaches.
### Interpretation
The diagram illustrates a common problem in the field of AI and machine learning: the "black box" nature of LLMs. While LLMs are powerful tools for processing and generating text, understanding *why* they make certain decisions can be difficult. The diagram suggests that integrating analytical methods like quality control, sensitivity analysis, game theory, and risk management with an LLM requires addressing the explainability barrier. This could involve developing techniques to make the LLM's reasoning more transparent or finding ways to translate the analytical methods into a format that the LLM can understand and explain. The diagram implies that direct integration is problematic, and that bridging the explainability gap is crucial for leveraging the full potential of both LLMs and traditional analytical techniques. The positioning of the methods suggests they are all potentially valuable inputs or components of a larger system powered by the LLM.