# Technical Document Extraction: Diagram Analysis
## Diagram Overview
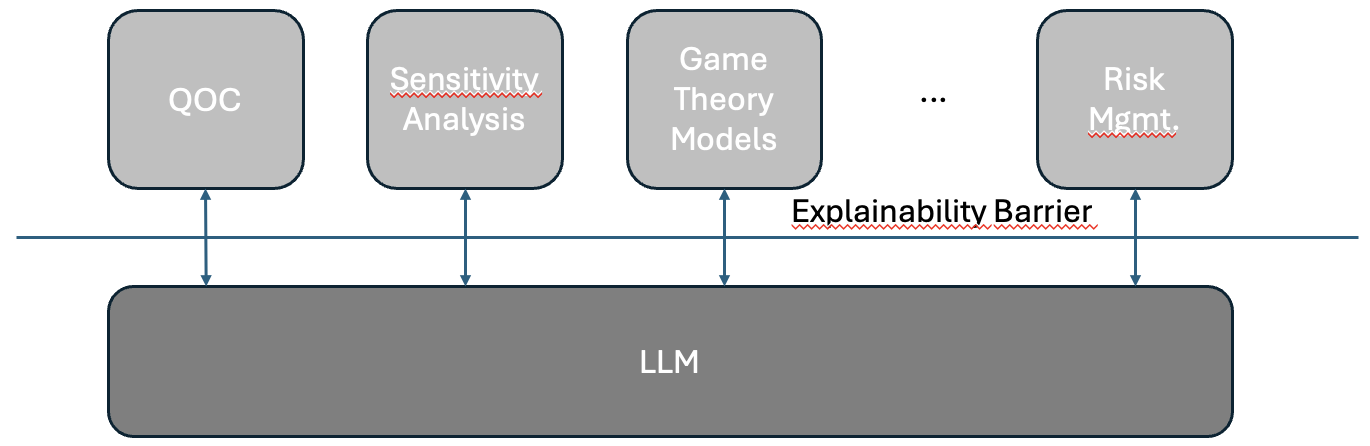
The image depicts a conceptual flow diagram illustrating the relationship between various analytical frameworks and a Large Language Model (LLM). The diagram uses geometric shapes, directional arrows, and labeled barriers to represent interactions and constraints.
---
## Component Breakdown
### Top Row (Input Frameworks)
1. **QOC**
- Position: Top-left rectangle
- Label: "QOC" (White text on gray background)
- Connection: Arrows point downward to the LLM
2. **Sensitivity Analysis**
- Position: Second rectangle from the left
- Label: "Sensitivity Analysis" (White text with red zigzag underline)
- Connection: Arrows point downward to the LLM
3. **Game Theory Models**
- Position: Third rectangle from the left
- Label: "Game Theory Models" (White text)
- Connection: Arrows point downward to the LLM
4. **Risk Mgmt.**
- Position: Top-right rectangle
- Label: "Risk Mgmt." (White text with red zigzag underline)
- Connection: Arrows point downward to the LLM
---
### Bottom Section (LLM)
- **LLM**
- Position: Long horizontal rectangle spanning the entire width of the diagram
- Label: "LLM" (White text on gray background)
- Role: Central recipient of input from all top-row frameworks
---
## Flow and Barriers
- **Directional Arrows**
- All top-row frameworks connect to the LLM via downward-pointing arrows.
- Arrows feature red zigzag lines, symbolizing **explainability barriers** in the interaction.
- **Explainability Barrier**
- Label: "Explainability Barrier" (Black text with red zigzag underline)
- Position: Horizontal line connecting the top-row frameworks to the LLM
- Function: Represents a conceptual obstacle in translating framework outputs into LLM-compatible inputs.
---
## Structural Notes
- **Color Coding**
- All components use a gray background with white text.
- Red zigzag lines emphasize barriers and constraints.
- **Absence of Numerical Data**
- The diagram is **conceptual** and does not include numerical values, trends, or data tables.
- **Spatial Grounding**
- Top-row frameworks are evenly spaced horizontally.
- The LLM occupies the full width of the diagram, acting as a unifying output layer.
---
## Key Observations
1. The diagram emphasizes **multi-framework integration** into an LLM, with explainability as a critical challenge.
2. Red zigzag lines visually reinforce the theme of **technical or conceptual barriers** across all connections.
3. No explicit hierarchy is implied between the top-row frameworks; all are treated as equal inputs to the LLM.
---
## Conclusion
This diagram illustrates a theoretical workflow where QOC, Sensitivity Analysis, Game Theory Models, and Risk Management frameworks interact with an LLM, constrained by explainability barriers. The absence of numerical data suggests it is intended for conceptual discussion rather than quantitative analysis.