## Line Chart: R1-Llama | MATH500 Accuracy vs. Ratio
### Overview
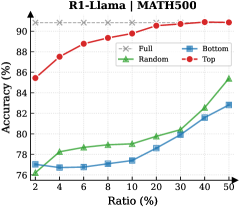
This line chart displays the accuracy of the R1-Llama model on the MATH500 dataset, plotted against different ratios. Four data series are presented: "Full", "Random", "Bottom", and "Top". The chart aims to demonstrate how the model's performance changes with varying proportions of data used, categorized by the selection method (Full, Random, Bottom, Top).
### Components/Axes
* **Title:** R1-Llama | MATH500
* **X-axis:** Ratio (%) - Scale ranges from approximately 2% to 50%. Markers are present at 2, 4, 6, 8, 10, 20, 30, 40, and 50.
* **Y-axis:** Accuracy (%) - Scale ranges from approximately 76% to 92%.
* **Legend:** Located in the top-right corner.
* "Full" - Represented by a black 'x' marker.
* "Random" - Represented by a green triangle marker.
* "Bottom" - Represented by a blue diamond marker.
* "Top" - Represented by a red circle marker.
### Detailed Analysis
* **Top (Red Line):** The "Top" line exhibits a strong upward trend, starting at approximately 85% accuracy at a ratio of 2%, increasing to around 91% at a ratio of 20%, and plateauing around 91.5% from 20% to 50%.
* Ratio 2%: ~85%
* Ratio 4%: ~87.5%
* Ratio 6%: ~88.5%
* Ratio 8%: ~89%
* Ratio 10%: ~90%
* Ratio 20%: ~91%
* Ratio 30%: ~91.2%
* Ratio 40%: ~91.4%
* Ratio 50%: ~91.5%
* **Random (Green Line):** The "Random" line shows a moderate upward trend. It begins at approximately 77.5% accuracy at 2%, gradually increasing to around 85% at 50%.
* Ratio 2%: ~77.5%
* Ratio 4%: ~78%
* Ratio 6%: ~78.5%
* Ratio 8%: ~79%
* Ratio 10%: ~79.5%
* Ratio 20%: ~81%
* Ratio 30%: ~82.5%
* Ratio 40%: ~84%
* Ratio 50%: ~85%
* **Bottom (Blue Line):** The "Bottom" line demonstrates a slow, but consistent, upward trend. It starts at approximately 76.5% accuracy at 2% and reaches around 82.5% at 50%.
* Ratio 2%: ~76.5%
* Ratio 4%: ~77%
* Ratio 6%: ~77.5%
* Ratio 8%: ~77.7%
* Ratio 10%: ~78%
* Ratio 20%: ~79%
* Ratio 30%: ~81%
* Ratio 40%: ~82%
* Ratio 50%: ~82.5%
* **Full (Black Line):** The "Full" line is relatively flat, hovering around 77% accuracy across all ratios.
* Ratio 2%: ~77%
* Ratio 4%: ~77%
* Ratio 6%: ~77%
* Ratio 8%: ~77%
* Ratio 10%: ~77%
* Ratio 20%: ~77%
* Ratio 30%: ~77%
* Ratio 40%: ~77%
* Ratio 50%: ~77%
### Key Observations
* The "Top" data selection method consistently yields the highest accuracy across all ratios.
* The "Full" data selection method shows the lowest and most stable accuracy.
* The "Bottom" data selection method has the slowest rate of accuracy improvement with increasing ratio.
* The "Random" data selection method performs better than "Bottom" but significantly worse than "Top".
### Interpretation
The data suggests that selecting the "Top" performing data points (presumably based on some initial evaluation metric) is the most effective strategy for maximizing the accuracy of the R1-Llama model on the MATH500 dataset. Using the full dataset ("Full") provides minimal benefit, and even performs worse than random selection. This implies that the MATH500 dataset contains a significant amount of noisy or irrelevant data, and focusing on the most informative subset ("Top") is crucial for achieving high accuracy. The relatively slow improvement of the "Bottom" selection method suggests that the least performing data points are not only unhelpful but may even hinder the model's learning process. The "Random" selection method provides a baseline performance, indicating that some degree of data selection is beneficial, but a targeted approach (like "Top") is far superior. The plateauing of the "Top" line at higher ratios suggests diminishing returns – beyond a certain point, adding more of the top-performing data does not significantly improve accuracy.