## Line Chart: R1-Llama | MATH500 Accuracy vs. Ratio
### Overview
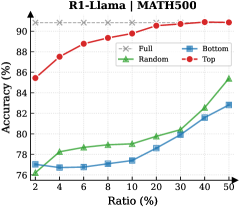
The chart compares the accuracy performance of four methods ("Full", "Top", "Bottom", "Random") across varying ratios (2-50%) on the MATH500 dataset. Accuracy is measured in percentage, with the "Full" method serving as a reference benchmark.
### Components/Axes
- **X-axis**: Ratio (%) - Discrete markers at 2, 4, 6, 8, 10, 20, 30, 40, 50
- **Y-axis**: Accuracy (%) - Continuous scale from 76 to 90
- **Legend**:
- Gray dashed line: Full (90% constant)
- Red solid line: Top
- Blue solid line: Bottom
- Green solid line: Random
- **Title**: Positioned at top-center in bold text
### Detailed Analysis
1. **Top (Red Line)**:
- Starts at ~85% accuracy at 2% ratio
- Gradually increases to ~90% by 50% ratio
- Maintains steady upward slope throughout
2. **Random (Green Line)**:
- Begins at ~76% accuracy at 2% ratio
- Accelerates sharply after 30% ratio
- Reaches ~85% accuracy at 50% ratio
3. **Bottom (Blue Line)**:
- Starts at ~76% accuracy at 2% ratio
- Shows minimal growth until 30% ratio
- Accelerates slightly after 30%, reaching ~83% at 50%
4. **Full (Gray Dashed Line)**:
- Horizontal reference line at 90% accuracy
- All methods fall short of this benchmark
### Key Observations
- The "Top" method demonstrates the most consistent improvement, closing the gap with the "Full" benchmark by 50% ratio
- "Random" method exhibits a threshold effect, with negligible gains below 30% ratio but significant improvement afterward
- "Bottom" method shows the slowest progress, maintaining ~76-78% accuracy until 30% ratio
- All methods except "Full" display non-linear growth patterns
### Interpretation
The data suggests that the "Top" method most effectively scales with increasing ratio, achieving near-optimal performance close to the "Full" benchmark. The "Random" method's performance characteristics imply potential utility in high-ratio scenarios despite poor initial results. The "Bottom" method's stagnant early performance raises questions about its architectural efficiency. The "Full" line likely represents theoretical maximum accuracy, serving as an aspirational target for model development. The divergence between methods at lower ratios highlights the importance of ratio optimization in model selection for MATH500 tasks.