## Diagram Type: Model Architectures Comparison
### Overview
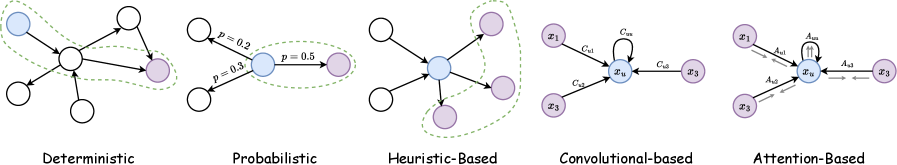
The image presents five distinct computational model architectures arranged horizontally, each labeled with its approach: Deterministic, Probabilistic, Heuristic-Based, Convolutional-based, and Attention-Based. Each diagram uses nodes (circles) and directional connections (arrows) to represent relationships, with varying annotations for probabilities, weights, and contextual elements.
### Components/Axes
- **Labels**:
- Deterministic
- Probabilistic
- Heuristic-Based
- Convolutional-based
- Attention-Based
- **Annotations**:
- Probabilistic diagram includes edge probabilities: `p = 0.2`, `p = 0.3`, `p = 0.5`.
- Convolutional-based diagram labels connections as `C_ux` (input-to-hidden) and `C_u3` (hidden-to-output).
- Attention-Based diagram labels attention weights as `A_ux1`, `A_ux2`, `A_ux3`.
- **Visual Elements**:
- Dashed green lines in Deterministic and Heuristic-Based diagrams suggest contextual or indirect relationships.
- Solid arrows indicate direct connections.
- Central nodes (blue) in all diagrams represent core processing units.
### Detailed Analysis
1. **Deterministic**:
- Central node connects to four peripheral nodes via solid arrows.
- Dashed green line loops around the central node and two peripheral nodes, implying a contextual or feedback mechanism.
2. **Probabilistic**:
- Central node (blue) connects to two peripheral nodes (white and purple) with labeled probabilities:
- `p = 0.2` (white → blue)
- `p = 0.3` (blue → white)
- `p = 0.5` (blue → purple)
- Probabilities suggest stochastic transitions between states.
3. **Heuristic-Based**:
- Central node connects to three peripheral nodes via solid arrows.
- Dashed green line encloses the central node and two peripheral nodes, indicating heuristic rules or contextual grouping.
4. **Convolutional-based**:
- Central node (`x_u`) connects to three peripheral nodes (`x1`, `x2`, `x3`) via labeled connections:
- `C_ux` (input-to-hidden)
- `C_u3` (hidden-to-output)
- Arrows emphasize hierarchical feature processing.
5. **Attention-Based**:
- Central node (`x_u`) connects to three peripheral nodes (`x1`, `x2`, `x3`) with attention weights:
- `A_ux1`, `A_ux2`, `A_ux3`
- Bidirectional arrows (e.g., `A_ux1` and `A_ux2`) suggest dynamic weighting of inputs.
### Key Observations
- **Progressive Complexity**: Models evolve from simple deterministic flows (Deterministic) to probabilistic transitions (Probabilistic), heuristic rules (Heuristic-Based), feature hierarchies (Convolutional-based), and dynamic attention mechanisms (Attention-Based).
- **Central Node Role**: All architectures share a central node as the primary processing unit, but its connectivity and contextual relationships vary.
- **Probabilistic Uncertainty**: The Probabilistic diagram explicitly quantifies uncertainty via edge probabilities, contrasting with deterministic certainty.
- **Attention Dynamics**: The Attention-Based model introduces asymmetric, weighted connections, reflecting adaptive focus on inputs.
### Interpretation
The diagrams illustrate a spectrum of computational strategies:
- **Deterministic** models rely on fixed, rule-based logic.
- **Probabilistic** models incorporate uncertainty, useful for stochastic environments.
- **Heuristic-Based** models use simplified rules for complex problems.
- **Convolutional-based** models prioritize hierarchical feature extraction (e.g., in neural networks).
- **Attention-Based** models dynamically allocate computational resources to relevant inputs, enhancing efficiency and adaptability.
The progression highlights increasing sophistication in handling uncertainty, context, and resource allocation. The Attention-Based model’s bidirectional arrows suggest a feedback loop, enabling iterative refinement—a key advantage in tasks like natural language processing or image recognition.