## Diagram: Different Types of Graph-Based Models
### Overview
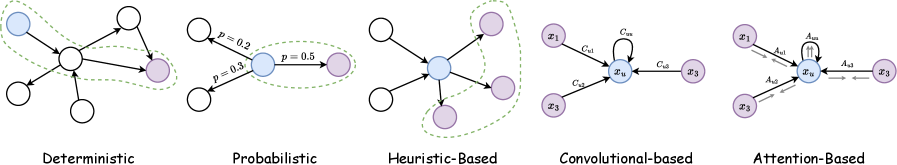
The image presents five different types of graph-based models: Deterministic, Probabilistic, Heuristic-Based, Convolutional-based, and Attention-Based. Each model is represented by a diagram showing nodes and edges, with variations in edge direction, node coloring, and annotations to illustrate the specific characteristics of each approach.
### Components/Axes
* **Nodes:** Represented by circles. Some nodes are colored light blue, while others are colored light purple. Uncolored nodes are white with black outlines.
* **Edges:** Represented by arrows, indicating the direction of influence or relationship between nodes.
* **Annotations:** Text labels and probability values are used to describe the relationships between nodes.
* **Grouping:** Dashed green lines are used to group certain nodes, possibly indicating a specific subset or module within the graph.
* **Model Types (Labels):** Located below each diagram, indicating the type of graph-based model.
### Detailed Analysis
1. **Deterministic:**
* A central white node receives input from a light blue node and several white nodes.
* The central node sends output to a light purple node and several white nodes.
* A dashed green line encompasses the light blue input node, the central node, and the light purple output node.
* Trend: Information flows from input nodes to a central node, then to output nodes in a defined manner.
2. **Probabilistic:**
* A light blue node is connected to a light purple node with an edge labeled "p = 0.5".
* The light blue node also receives input from two white nodes, with edges labeled "p = 0.3" and "p = 0.2".
* A dashed green line encompasses the light blue node and the light purple node.
* Trend: Edges are associated with probabilities, indicating the likelihood of information flow.
3. **Heuristic-Based:**
* A light blue node is connected to several white nodes and light purple nodes.
* A dashed green line encompasses the light purple nodes.
* Trend: A central node influences multiple nodes based on heuristic rules.
4. **Convolutional-based:**
* Nodes are labeled as x1, xu, and x3.
* Edges are labeled as Cu1, Cu2, and Cu3.
* There is a self-loop on node xu, labeled as Cuu.
* Trend: Information is aggregated from neighboring nodes using convolutional operations.
5. **Attention-Based:**
* Nodes are labeled as x1, xu, and x3.
* Edges are labeled as Au1, Au2, and Au3.
* There is a self-loop on node xu, with bidirectional arrows.
* Trend: The influence of neighboring nodes is weighted based on attention mechanisms.
### Key Observations
* The diagrams illustrate different approaches to modeling relationships between nodes in a graph.
* The use of color (light blue and light purple) may indicate different types of nodes or roles within the graph.
* The presence of probabilities in the "Probabilistic" model highlights the uncertainty associated with certain relationships.
* The "Convolutional-based" and "Attention-Based" models introduce specific operations for aggregating information from neighboring nodes.
### Interpretation
The image provides a visual comparison of different graph-based models, highlighting their unique characteristics and approaches to representing relationships between nodes. The "Deterministic" model represents a straightforward flow of information, while the "Probabilistic" model introduces uncertainty. The "Heuristic-Based" model suggests a rule-based approach, while the "Convolutional-based" and "Attention-Based" models incorporate more complex operations for aggregating information. The choice of model depends on the specific application and the nature of the relationships being modeled.