# Technical Document Extraction: Heatmap Analysis
## 1. Axis Labels and Titles
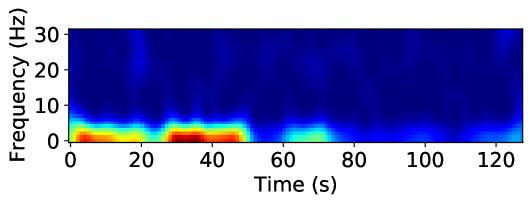
- **X-Axis**: Labeled "Time (s)" with numerical markers at intervals of 20 seconds (0, 20, 40, 60, 80, 100, 120).
- **Y-Axis**: Labeled "Frequency (Hz)" with numerical markers at intervals of 10 Hz (0, 10, 20, 30).
## 2. Color Gradient and Intensity
- **Color Scale**:
- Red → Yellow → Green → Blue (high to low intensity).
- No explicit legend provided; gradient inferred from color transitions.
- **Key Observations**:
- **High-Intensity Regions** (Red/Yellow):
- Concentrated near the bottom of the y-axis (0–5 Hz).
- Temporal clustering between **0–40 seconds**.
- **Low-Intensity Regions** (Blue):
- Dominates the upper y-axis (5–30 Hz) and extends across the full time range (0–120 seconds).
## 3. Key Trends
- **Initial High-Frequency Activity**:
- Between **0–40 seconds**, a distinct red/yellow band indicates elevated intensity at lower frequencies (0–5 Hz).
- This activity diminishes sharply after 40 seconds, transitioning to blue.
- **Stable Low-Intensity State**:
- From **40–120 seconds**, the heatmap remains predominantly blue, suggesting minimal or no activity at higher frequencies (5–30 Hz).
## 4. Spatial Grounding and Component Isolation
- **Region Segmentation**:
- **Header**: No textual elements present.
- **Main Chart**:
- Time (x-axis) spans 0–120 seconds.
- Frequency (y-axis) spans 0–30 Hz.
- Color gradient dominates the visualization.
- **Footer**: No textual elements present.
- **Legend**: Absent in the image.
## 5. Data Interpretation
- **Temporal Dynamics**:
- The heatmap suggests a transient event or process occurring between **0–40 seconds**, characterized by high-intensity activity at low frequencies.
- Post-40 seconds, the system stabilizes, with no significant activity detected across the frequency range.
- **Frequency Distribution**:
- Activity is predominantly localized to the lowest frequency band (0–5 Hz) during the initial phase.
- Higher frequencies (5–30 Hz) show negligible or absent activity throughout the observed period.
## 6. Notes
- No textual annotations, legends, or data tables are present in the image.
- The absence of a legend limits quantitative interpretation of the color gradient.
- The heatmap implies a time-dependent phenomenon with a sharp decline in activity after 40 seconds.
## 7. Conclusion
The heatmap visualizes a transient, high-intensity event at low frequencies (0–5 Hz) occurring between **0–40 seconds**, followed by a stable, low-activity state. Further analysis would require additional context or calibration data to quantify the intensity scale.