## Chart: Probability Distribution Comparison
### Overview
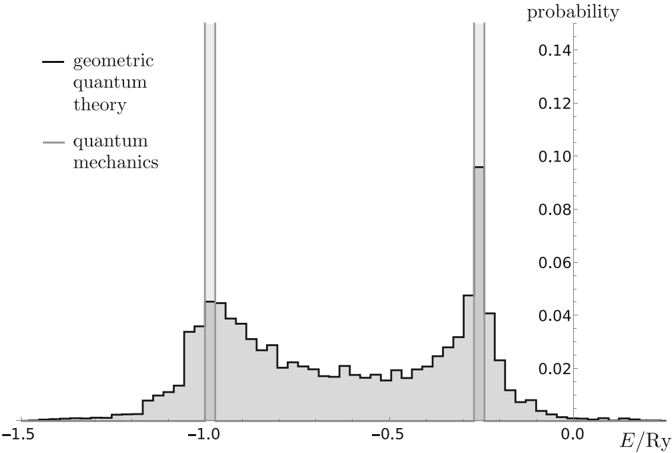
The image is a histogram comparing the probability distributions predicted by "geometric quantum theory" and "quantum mechanics" as a function of energy. The x-axis represents energy (E/Ry), and the y-axis represents probability. The geometric quantum theory is represented by a black line, and quantum mechanics is represented by a filled gray area.
### Components/Axes
* **X-axis:** E/Ry (Energy in Rydberg units). Scale ranges from -1.5 to 0.0, with tick marks at -1.5, -1.0, -0.5, and 0.0.
* **Y-axis:** probability. Scale ranges from 0.0 to 0.14, with tick marks at 0.0, 0.02, 0.04, 0.06, 0.08, 0.10, 0.12, and 0.14.
* **Legend (Top-Left):**
* Black line: geometric quantum theory
* Gray filled area: quantum mechanics
### Detailed Analysis
* **Geometric Quantum Theory (Black Line):**
* The distribution starts near zero probability at E/Ry = -1.5.
* The probability increases gradually until around E/Ry = -1.0.
* There is a sharp peak around E/Ry = -1.0.
* The probability decreases to a minimum around E/Ry = -0.5.
* The probability increases again, forming another sharp peak around E/Ry = -0.1.
* The probability decreases to near zero at E/Ry = 0.0.
* **Quantum Mechanics (Gray Filled Area):**
* The distribution starts near zero probability at E/Ry = -1.5.
* The probability increases gradually until around E/Ry = -1.0.
* There is a sharp peak around E/Ry = -1.0.
* The probability decreases to a minimum around E/Ry = -0.5.
* The probability increases again, forming another sharp peak around E/Ry = -0.1.
* The probability decreases to near zero at E/Ry = 0.0.
* **Specific Data Points (Approximate):**
* Peak probability for both theories occurs near E/Ry = -0.1 and E/Ry = -1.0.
* Minimum probability for both theories occurs near E/Ry = -0.5.
* The peak probability near E/Ry = -0.1 is approximately 0.10 for quantum mechanics and 0.05 for geometric quantum theory.
* The peak probability near E/Ry = -1.0 is approximately 0.10 for quantum mechanics and 0.05 for geometric quantum theory.
* The minimum probability near E/Ry = -0.5 is approximately 0.025 for quantum mechanics and 0.015 for geometric quantum theory.
### Key Observations
* Both theories predict similar qualitative behavior, with peaks near E/Ry = -1.0 and E/Ry = -0.1, and a minimum near E/Ry = -0.5.
* The quantum mechanics distribution (gray area) generally has higher probabilities than the geometric quantum theory distribution (black line).
* The peaks in the quantum mechanics distribution are more pronounced than in the geometric quantum theory distribution.
### Interpretation
The chart compares the probability distributions of energy levels as predicted by geometric quantum theory and standard quantum mechanics. The similarity in the shape of the distributions suggests that both theories capture the essential physics of the system. However, the differences in the peak heights and overall probabilities indicate quantitative discrepancies between the two theories. The higher probabilities predicted by quantum mechanics at the peaks may suggest that these energy levels are more likely to be occupied according to standard quantum mechanics compared to geometric quantum theory. The peaks at E/Ry = -1.0 and E/Ry = -0.1 likely correspond to specific energy levels or states within the system being modeled. The minimum at E/Ry = -0.5 suggests a region of lower probability for energy states.