## Line Chart: Throughput vs. Batch Size for Different 'k' Values
### Overview
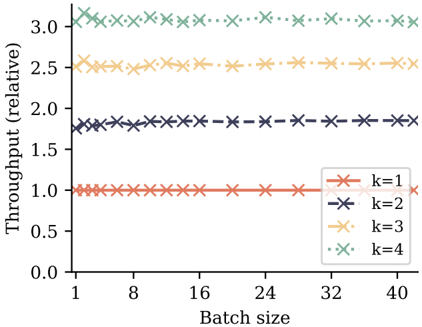
The image is a line chart that illustrates the relationship between throughput (relative) and batch size for four different values of 'k' (k=1, k=2, k=3, k=4). The chart shows how throughput changes as batch size increases, with each line representing a different 'k' value.
### Components/Axes
* **X-axis:** Batch size, with markers at 1, 8, 16, 24, 32, and 40.
* **Y-axis:** Throughput (relative), with markers at 0.0, 0.5, 1.0, 1.5, 2.0, 2.5, and 3.0.
* **Legend (bottom-right):**
* k=1 (coral color, solid line with 'x' markers)
* k=2 (dark blue color, dashed line with 'x' markers)
* k=3 (light orange color, dotted line with 'x' markers)
* k=4 (light green color, dotted line with 'x' markers)
### Detailed Analysis
* **k=1 (coral, solid line):** The throughput remains relatively constant at approximately 1.0 across all batch sizes.
* Batch size 1: Throughput ~1.0
* Batch size 40: Throughput ~1.0
* **k=2 (dark blue, dashed line):** The throughput starts at approximately 1.75 at batch size 1, increases slightly to approximately 1.85 by batch size 8, and then remains relatively constant around 1.85 for larger batch sizes.
* Batch size 1: Throughput ~1.75
* Batch size 8: Throughput ~1.85
* Batch size 40: Throughput ~1.85
* **k=3 (light orange, dotted line):** The throughput starts at approximately 2.45 at batch size 1, increases slightly to approximately 2.55 by batch size 8, and then remains relatively constant around 2.55 for larger batch sizes.
* Batch size 1: Throughput ~2.45
* Batch size 8: Throughput ~2.55
* Batch size 40: Throughput ~2.55
* **k=4 (light green, dotted line):** The throughput starts at approximately 3.05 at batch size 1, increases slightly to approximately 3.15 by batch size 8, and then remains relatively constant around 3.15 for larger batch sizes.
* Batch size 1: Throughput ~3.05
* Batch size 8: Throughput ~3.15
* Batch size 40: Throughput ~3.15
### Key Observations
* Throughput generally increases with increasing 'k' value.
* For each 'k' value, throughput is relatively stable across different batch sizes, with a slight increase from batch size 1 to batch size 8.
* The lines for k=2, k=3, and k=4 show a slight increase in throughput between batch sizes 1 and 8, after which they plateau.
### Interpretation
The chart suggests that increasing the 'k' value leads to a higher throughput. However, the batch size has a minimal impact on throughput, especially for batch sizes greater than 8. The 'k' parameter appears to be a more significant factor in determining throughput than batch size. The data implies that optimizing 'k' is more crucial for improving throughput than adjusting the batch size, at least within the range of batch sizes considered in the chart.