## Line Chart: Relative Throughput vs. Batch Size for Different k Values
### Overview
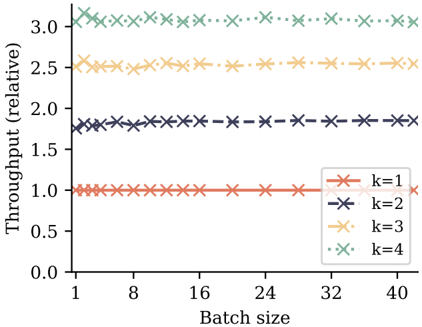
The image is a line chart plotting "Throughput (relative)" on the vertical y-axis against "Batch size" on the horizontal x-axis. It displays four distinct data series, each corresponding to a different value of a parameter `k` (k=1, k=2, k=3, k=4). The chart demonstrates how relative throughput changes (or does not change) as the batch size increases for each fixed `k`.
### Components/Axes
* **Y-Axis (Vertical):**
* **Label:** "Throughput (relative)"
* **Scale:** Linear, ranging from 0.0 to 3.0.
* **Major Tick Marks:** 0.0, 0.5, 1.0, 1.5, 2.0, 2.5, 3.0.
* **X-Axis (Horizontal):**
* **Label:** "Batch size"
* **Scale:** Appears to be linear, with labeled major ticks.
* **Major Tick Marks (Labeled):** 1, 8, 16, 24, 32, 40.
* **Legend:**
* **Position:** Bottom-right corner of the chart area.
* **Entries (from top to bottom as listed in legend box):**
1. `k=1`: Red line with 'x' markers.
2. `k=2`: Dark blue/gray line with 'x' markers.
3. `k=3`: Orange line with '+' markers.
4. `k=4`: Green line with '.' (dot) markers.
### Detailed Analysis
The chart contains four horizontal data series, indicating that for each value of `k`, the relative throughput is constant and independent of the batch size within the displayed range (1 to 40).
1. **Series `k=1` (Red, 'x' markers):**
* **Trend:** Perfectly horizontal line.
* **Value:** Constant at y = 1.0. This likely serves as the baseline for "relative" throughput.
* **Data Points:** Markers are placed at every labeled x-axis tick (1, 8, 16, 24, 32, 40) and at intermediate points, all at y=1.0.
2. **Series `k=2` (Dark Blue/Gray, 'x' markers):**
* **Trend:** Perfectly horizontal line.
* **Value:** Constant at approximately y = 1.8.
* **Data Points:** Markers are consistently placed at y ≈ 1.8 across all batch sizes.
3. **Series `k=3` (Orange, '+' markers):**
* **Trend:** Perfectly horizontal line.
* **Value:** Constant at approximately y = 2.5.
* **Data Points:** Markers are consistently placed at y ≈ 2.5 across all batch sizes.
4. **Series `k=4` (Green, '.' markers):**
* **Trend:** Perfectly horizontal line.
* **Value:** Constant at approximately y = 3.0.
* **Data Points:** Markers are consistently placed at y ≈ 3.0 across all batch sizes.
### Key Observations
* **Perfect Linearity:** All four series show zero slope. Throughput does not scale with batch size for any given `k`.
* **Clear Stratification:** The lines are perfectly parallel and evenly spaced in the vertical direction. There is a clear, positive relationship between the parameter `k` and the relative throughput level.
* **Baseline Identification:** The `k=1` series at y=1.0 establishes the reference point. Other values are multiples of this baseline (e.g., k=4 provides ~3x the throughput of k=1).
* **Marker Consistency:** Each series uses a unique combination of color and marker shape, which is consistently applied and clearly distinguishable.
### Interpretation
This chart presents a clear performance characteristic: **Relative throughput is determined solely by the parameter `k` and is invariant to batch size** within the tested range.
* **What the data suggests:** The system or algorithm being measured exhibits perfect scaling with respect to `k`. Increasing `k` from 1 to 2, 3, or 4 yields predictable, multiplicative improvements in throughput (approximately 1.8x, 2.5x, and 3.0x, respectively). The lack of dependence on batch size implies that the throughput bottleneck is not related to batch processing overhead or parallelization efficiency within these batch sizes. The performance is likely bound by a fixed resource or computational pathway that scales directly with `k`.
* **How elements relate:** The legend directly maps the abstract parameter `k` to a visual encoding (color/marker). The vertical position of each horizontal line is the direct visual representation of the throughput value for that `k`. The x-axis, while necessary to show the experiment's scope, ultimately demonstrates a non-factor in this specific performance metric.
* **Notable patterns/anomalies:** The most striking pattern is the perfect flatness of the lines. In real-world systems, one might expect some minor variance or a slight curve at very low or high batch sizes. The absence of any such deviation suggests either a highly idealized model, a theoretical result, or a system operating in a regime where batch size is completely decoupled from the throughput mechanism. The consistent, integer-like spacing between lines (1.0 -> ~1.8 -> ~2.5 -> ~3.0) may hint at an underlying mathematical relationship between `k` and throughput (e.g., throughput ∝ √k or a similar sub-linear function).