# Technical Document Extraction: Model Performance Comparison
## 1. Image Overview
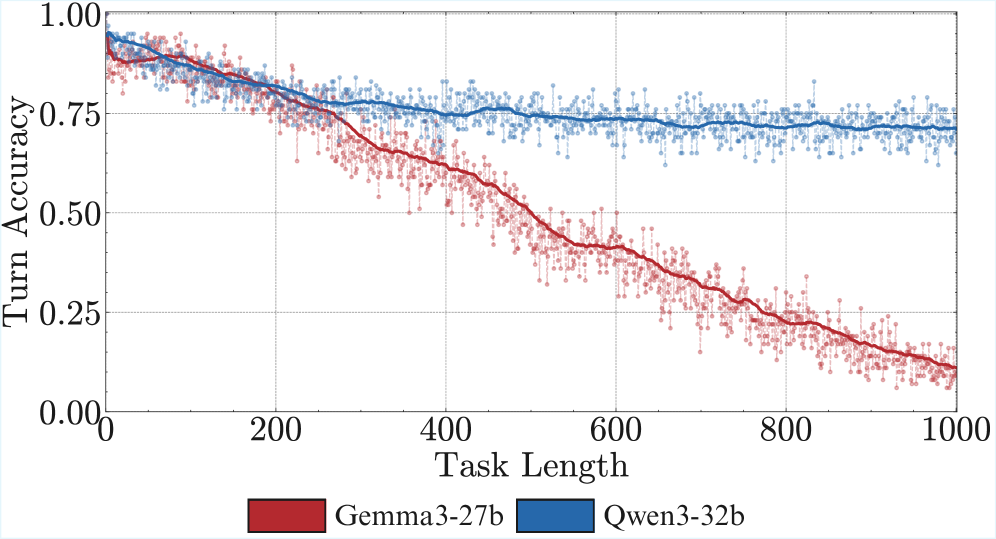
This image is a line graph comparing the performance of two Large Language Models (LLMs) across increasing task lengths. It plots "Turn Accuracy" against "Task Length."
## 2. Component Isolation
### Header / Metadata
* **Language:** English
* **Content:** None (The image starts directly with the chart area).
### Main Chart Area
* **Y-Axis Label:** Turn Accuracy
* **Y-Axis Scale:** 0.00 to 1.00 (increments of 0.25 marked, with grid lines every 0.25).
* **X-Axis Label:** Task Length
* **X-Axis Scale:** 0 to 1000 (increments of 200 marked).
* **Grid:** A light gray dashed grid is present for both axes.
* **Data Representation:** Each model is represented by a solid trend line (likely a moving average) and a scatter plot of semi-transparent points connected by thin dashed lines representing raw data variance.
### Footer / Legend
* **Spatial Placement:** Centered at the bottom of the image.
* **Legend Items:**
* **Red Box:** Gemma3-27b
* **Blue Box:** Qwen3-32b
---
## 3. Data Series Analysis and Trend Verification
### Series 1: Qwen3-32b (Blue)
* **Visual Trend:** The line starts at a high accuracy (~0.95). It shows a very gradual, slight downward slope as task length increases, but remains remarkably stable. It plateaus and maintains a high level of performance even at the maximum task length.
* **Key Data Points:**
* **Start (Length 0):** ~0.95 Accuracy.
* **Midpoint (Length 500):** ~0.75 Accuracy.
* **End (Length 1000):** ~0.70 Accuracy.
* **Variance:** The raw data points (light blue) show moderate fluctuation around the trend line, staying mostly between 0.65 and 0.85 after the initial drop.
### Series 2: Gemma3-27b (Red)
* **Visual Trend:** The line starts at a high accuracy (~0.90), similar to Qwen. However, it exhibits a significant and consistent downward slope (negative correlation) as task length increases. The performance degrades much more rapidly than the blue series.
* **Key Data Points:**
* **Start (Length 0):** ~0.90 Accuracy.
* **Intersection Point:** At approximately Task Length 200, both models have an accuracy of ~0.80.
* **Midpoint (Length 500):** ~0.50 Accuracy.
* **End (Length 1000):** ~0.10 Accuracy.
* **Variance:** The raw data points (light red) show high fluctuation, with some points dropping toward 0.00 and others reaching up to 0.25 near the end of the task length.
---
## 4. Comparative Summary
The chart demonstrates a clear performance gap between the two models as task complexity or duration (Task Length) increases.
| Metric | Qwen3-32b (Blue) | Gemma3-27b (Red) |
| :--- | :--- | :--- |
| **Initial Accuracy** | High (~0.95) | High (~0.90) |
| **Stability** | High; maintains >0.70 accuracy | Low; drops to ~0.10 accuracy |
| **Degradation Rate** | Minimal/Gradual | Significant/Linear |
| **Performance at Length 1000** | ~0.70 | ~0.10 |
**Conclusion:** Qwen3-32b is significantly more robust to long-form tasks than Gemma3-27b, which suffers from a near-total loss of accuracy as the task length approaches 1000.