## Line Chart: Win Rate vs. Expected Response Length
### Overview
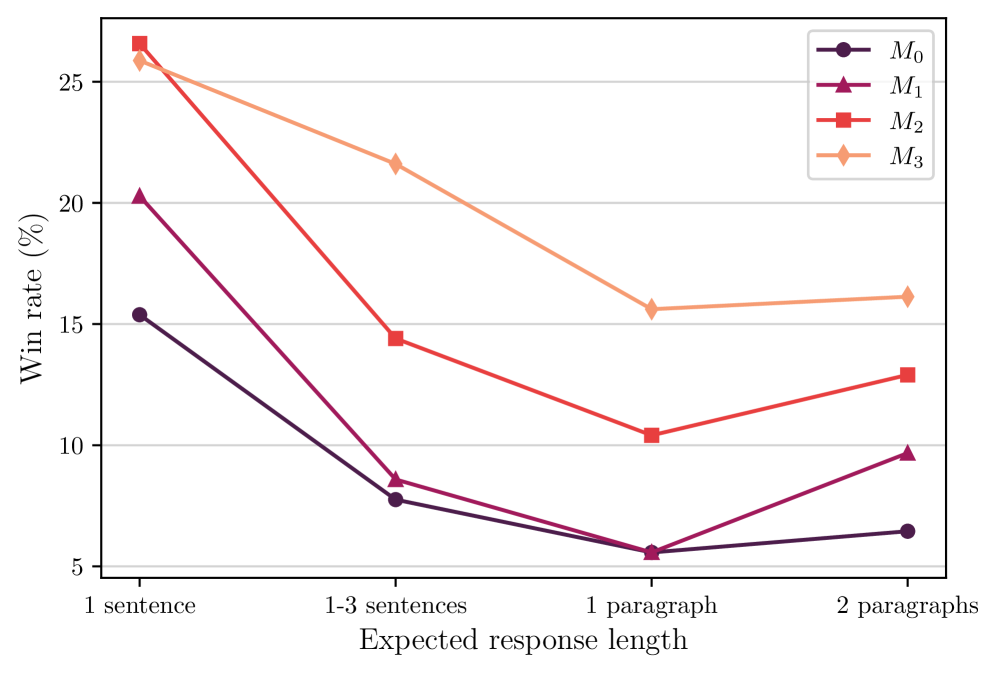
The image is a line chart that displays the win rate (in percentage) against the expected response length. There are four data series, labeled M0, M1, M2, and M3, each represented by a different colored line with distinct markers. The x-axis represents the expected response length, categorized into "1 sentence", "1-3 sentences", "1 paragraph", and "2 paragraphs".
### Components/Axes
* **X-axis:** "Expected response length" with categories: "1 sentence", "1-3 sentences", "1 paragraph", and "2 paragraphs".
* **Y-axis:** "Win rate (%)" with a scale from 5 to 25, incrementing by 5.
* **Legend:** Located in the top-right corner, it identifies the four data series:
* M0: Dark purple line with circle markers.
* M1: Purple-red line with triangle markers.
* M2: Red line with square markers.
* M3: Light orange line with diamond markers.
### Detailed Analysis
**M0 (Dark Purple, Circle Markers):**
* Trend: Decreases sharply from "1 sentence" to "1 paragraph", then slightly increases.
* Data Points:
* 1 sentence: ~15.5%
* 1-3 sentences: ~8%
* 1 paragraph: ~6%
* 2 paragraphs: ~6.5%
**M1 (Purple-Red, Triangle Markers):**
* Trend: Decreases from "1 sentence" to "1 paragraph", then increases.
* Data Points:
* 1 sentence: ~20.5%
* 1-3 sentences: ~8%
* 1 paragraph: ~6%
* 2 paragraphs: ~10%
**M2 (Red, Square Markers):**
* Trend: Decreases from "1 sentence" to "1 paragraph", then increases.
* Data Points:
* 1 sentence: ~26.5%
* 1-3 sentences: ~14.5%
* 1 paragraph: ~10.5%
* 2 paragraphs: ~13%
**M3 (Light Orange, Diamond Markers):**
* Trend: Decreases from "1 sentence" to "1 paragraph", then slightly increases.
* Data Points:
* 1 sentence: ~26%
* 1-3 sentences: ~22%
* 1 paragraph: ~16%
* 2 paragraphs: ~16%
### Key Observations
* M2 and M3 have the highest win rates when the expected response length is "1 sentence".
* All models experience a decrease in win rate as the expected response length increases from "1 sentence" to "1 paragraph".
* M0 and M1 have the lowest win rates at "1 paragraph".
* M1 and M2 show an increase in win rate from "1 paragraph" to "2 paragraphs".
### Interpretation
The chart suggests that the win rate is influenced by the expected response length. Models M2 and M3 perform best when a short response (1 sentence) is expected. As the expected response length increases to a paragraph, the win rates for all models decrease, indicating a potential challenge in handling longer responses. The increase in win rate for M1 and M2 from "1 paragraph" to "2 paragraphs" suggests that these models might benefit from more context or a more elaborate response structure. The data indicates that the optimal response length varies depending on the specific model (M0, M1, M2, M3).