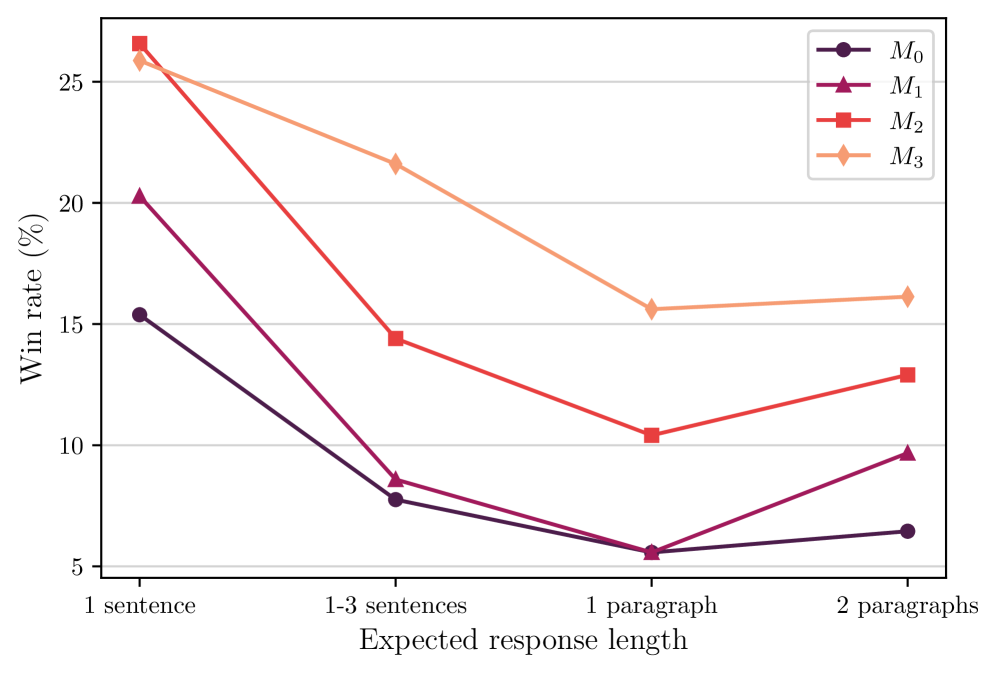
# Technical Data Extraction: Win Rate by Expected Response Length
## 1. Metadata and Layout
- **Chart Type:** Multi-series line graph with markers.
- **Y-Axis Label:** Win rate (%)
- **Y-Axis Scale:** 5 to 25 with major gridlines every 5 units.
- **X-Axis Label:** Expected response length
- **X-Axis Categories:**
1. 1 sentence
2. 1-3 sentences
3. 1 paragraph
4. 2 paragraphs
- **Legend Location:** Top-right corner [x=0.8, y=0.85 approx].
## 2. Legend and Data Series Identification
The chart tracks four distinct models ($M_0$ through $M_3$), each represented by a specific color and marker shape:
| Series Label | Color | Marker Shape | Visual Trend Description |
| :--- | :--- | :--- | :--- |
| **$M_0$** | Dark Purple / Black | Circle (●) | Sharp decline from 1 sentence to 1-3 sentences, then tapers off with a slight uptick at the end. Lowest overall win rates. |
| **$M_1$** | Maroon / Magenta | Triangle (▲) | Sharp decline until "1 paragraph," then shows a moderate recovery at "2 paragraphs." |
| **$M_2$** | Red | Square (■) | Starts highest, drops significantly to "1 paragraph," then recovers slightly at "2 paragraphs." |
| **$M_3$** | Peach / Light Orange | Diamond (◆) | Consistent downward slope until "1 paragraph," followed by a plateau/slight increase. Highest win rate for longer responses. |
## 3. Data Point Extraction (Approximate Values)
| Expected Response Length | $M_0$ (●) | $M_1$ (▲) | $M_2$ (■) | $M_3$ (◆) |
| :--- | :---: | :---: | :---: | :---: |
| **1 sentence** | ~15.4% | ~20.3% | ~26.5% | ~25.8% |
| **1-3 sentences** | ~7.8% | ~8.6% | ~14.4% | ~21.6% |
| **1 paragraph** | ~5.6% | ~5.6% | ~10.4% | ~15.6% |
| **2 paragraphs** | ~6.5% | ~9.7% | ~12.9% | ~16.1% |
## 4. Key Observations and Trends
- **General Trend:** All models exhibit their highest win rates for the shortest response length ("1 sentence") and experience a significant performance drop as the expected response length increases.
- **Performance Crossover:** While $M_2$ (Red) starts with the highest win rate at the "1 sentence" mark, $M_3$ (Peach) becomes the top-performing model for all response lengths exceeding one sentence.
- **The "1 Paragraph" Dip:** All four models reach their lowest win rate performance at the "1 paragraph" mark.
- **Recovery Phase:** Every model shows a slight improvement in win rate when moving from "1 paragraph" to "2 paragraphs," suggesting a non-linear relationship between length and performance.
- **Model Ranking:** In the longest category (2 paragraphs), the performance hierarchy is clearly defined: $M_3 > M_2 > M_1 > M_0$.