## Line Chart: Win rate (%) vs. Expected response length
### Overview
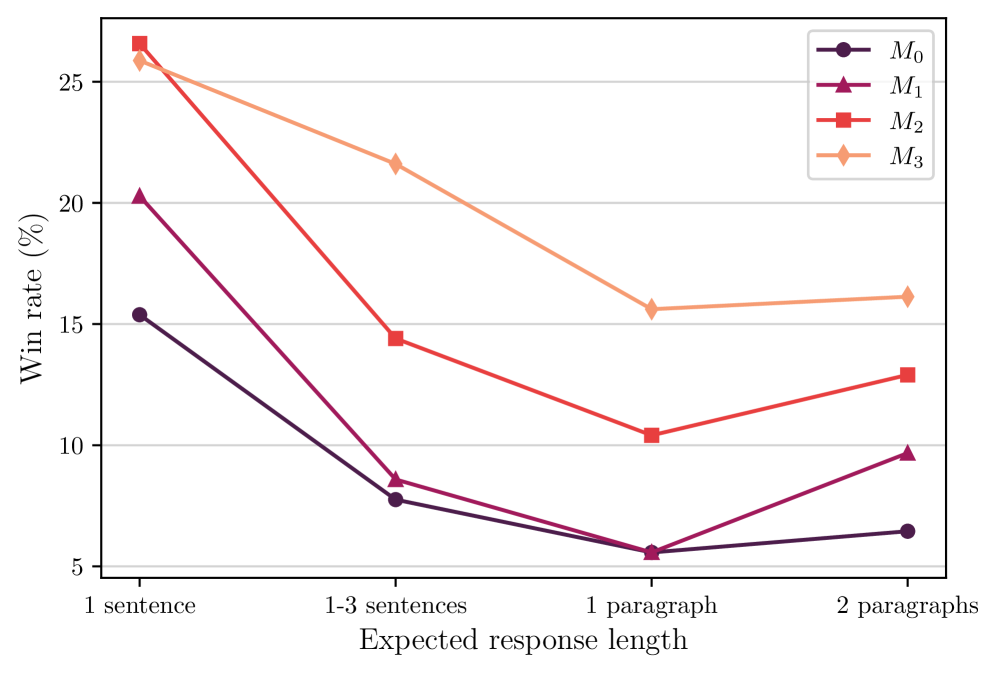
This is a line chart comparing the performance of four different models (M0, M1, M2, M3) across four categories of expected response length. The performance metric is "Win rate (%)". The chart shows that win rates generally decrease as response length increases from a single sentence to a paragraph, with a slight recovery or stabilization for the longest category.
### Components/Axes
* **Chart Type:** Line chart with markers.
* **X-Axis (Horizontal):** Labeled "Expected response length". It has four categorical tick marks:
1. "1 sentence"
2. "1-3 sentences"
3. "1 paragraph"
4. "2 paragraphs"
* **Y-Axis (Vertical):** Labeled "Win rate (%)". It is a linear scale with major gridlines and numerical markers at 5, 10, 15, 20, and 25.
* **Legend:** Located in the top-right corner of the plot area. It defines four data series:
* **M0:** Dark purple line with circle markers.
* **M1:** Magenta line with triangle markers.
* **M2:** Red-orange line with square markers.
* **M3:** Light orange/peach line with diamond markers.
### Detailed Analysis
**Data Series and Approximate Values:**
* **M0 (Dark Purple, Circles):**
* Trend: Steep downward slope from "1 sentence" to "1 paragraph", then a very slight upward slope to "2 paragraphs".
* Values:
* 1 sentence: ~15.5%
* 1-3 sentences: ~7.8%
* 1 paragraph: ~5.5%
* 2 paragraphs: ~6.5%
* **M1 (Magenta, Triangles):**
* Trend: Very steep downward slope from "1 sentence" to "1 paragraph", followed by a moderate upward slope to "2 paragraphs".
* Values:
* 1 sentence: ~20.2%
* 1-3 sentences: ~8.6%
* 1 paragraph: ~5.6%
* 2 paragraphs: ~9.7%
* **M2 (Red-Orange, Squares):**
* Trend: Steep downward slope from "1 sentence" to "1 paragraph", then a moderate upward slope to "2 paragraphs".
* Values:
* 1 sentence: ~26.5%
* 1-3 sentences: ~14.4%
* 1 paragraph: ~10.4%
* 2 paragraphs: ~12.9%
* **M3 (Light Orange, Diamonds):**
* Trend: Consistent downward slope from "1 sentence" to "1 paragraph", then a very slight upward slope to "2 paragraphs". It maintains the highest win rate at every data point.
* Values:
* 1 sentence: ~25.8%
* 1-3 sentences: ~21.6%
* 1 paragraph: ~15.6%
* 2 paragraphs: ~16.1%
### Key Observations
1. **Universal Dip at "1 Paragraph":** All four models achieve their lowest win rate at the "1 paragraph" response length category.
2. **Performance Hierarchy:** The relative ranking of the models is consistent across all response lengths: M3 > M2 > M1 > M0.
3. **Initial Drop Severity:** The drop in win rate from "1 sentence" to "1-3 sentences" is most severe for M1 and M0. M3 shows the most gradual initial decline.
4. **Recovery Pattern:** All models show a slight increase in win rate when moving from "1 paragraph" to "2 paragraphs", suggesting a potential performance rebound for longer-form responses after a mid-length trough.
5. **Highest and Lowest Points:** The highest win rate on the chart is for M2 at "1 sentence" (~26.5%). The lowest win rates are for M0 and M1 at "1 paragraph" (~5.5-5.6%).
### Interpretation
The data suggests a non-linear relationship between expected response length and model win rate. The consistent dip at "1 paragraph" indicates a potential "valley of difficulty" where models struggle most—perhaps this length is long enough to introduce complexity but not long enough for the models to fully develop a coherent, high-quality response that wins comparisons.
The clear and consistent performance hierarchy (M3 > M2 > M1 > M0) implies fundamental differences in model capability, training, or architecture that are evident regardless of response length. M3's superior performance, especially its more gradual decline, suggests it is more robust to increases in response length.
The slight recovery at "2 paragraphs" is intriguing. It could indicate that for very long responses, other factors (like comprehensiveness or structure) become more important in determining a "win," playing to different strengths of the models. Alternatively, it might reflect a selection bias in the evaluation data for that category.
**In summary:** The chart demonstrates that model performance, as measured by win rate, is highly sensitive to expected response length, with a notable performance trough at the paragraph length. It also reveals a stable ranking of model effectiveness across all tested lengths.