## Scatter Plot: Layer 20, head 8
### Overview
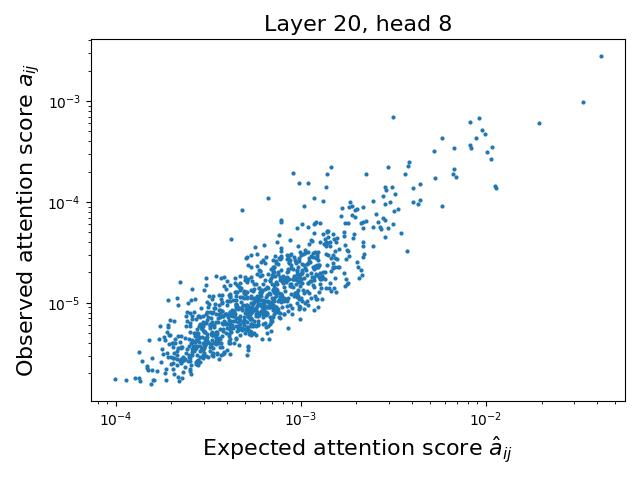
The image is a scatter plot comparing **observed attention scores** (y-axis) to **expected attention scores** (x-axis) for a neural network layer (Layer 20, head 8). Both axes use logarithmic scales, with data points distributed across a wide range of magnitudes. The plot reveals a general trend where observed scores are lower than expected, with notable outliers.
---
### Components/Axes
- **Title**: "Layer 20, head 8" (top-center, black text).
- **X-axis**:
- Label: "Expected attention score a<sub>ij</sub>" (black text).
- Scale: Logarithmic, ranging from **10⁻⁴** (left) to **10⁻²** (right).
- **Y-axis**:
- Label: "Observed attention score a<sub>ij</sub>" (black text).
- Scale: Logarithmic, ranging from **10⁻⁵** (bottom) to **10⁻³** (top).
- **Data Points**:
- Blue dots (no legend; color implied by title).
- Approximately **100–200 points** scattered across the plot.
---
### Detailed Analysis
- **Distribution**:
- Most points cluster in the **lower-left quadrant** (expected scores ~10⁻³ to 10⁻⁴, observed scores ~10⁻⁵ to 10⁻⁴).
- A diagonal band of points extends from the lower-left to the upper-right, suggesting a weak positive correlation.
- Outliers appear in the **upper-right** (observed scores > expected scores by orders of magnitude) and **lower-left** (observed scores << expected scores).
- **Trends**:
- The majority of points lie **below the line of equality** (observed < expected), indicating underperformance relative to expectations.
- A few points in the upper-right quadrant (e.g., expected ~10⁻², observed ~10⁻³) show observed scores exceeding expectations by ~10x.
- The log scale compresses the spread, making small differences appear larger visually.
---
### Key Observations
1. **Clustering**: Dense grouping in the lower-left suggests most attention scores are significantly lower than expected.
2. **Outliers**:
- Upper-right outliers (e.g., expected ~10⁻², observed ~10⁻³) may indicate rare but high-impact attention events.
- Lower-left outliers (e.g., expected ~10⁻³, observed ~10⁻⁵) suggest near-zero observed attention despite non-negligible expectations.
3. **Scale Effects**: The logarithmic axes emphasize multiplicative differences, making the spread appear more linear.
---
### Interpretation
- **Model Behavior**: The plot implies that the attention mechanism in Layer 20, head 8, often underperforms relative to expectations. This could reflect inefficiencies in attention allocation or mismatches between model predictions and actual data patterns.
- **Outliers**: The upper-right outliers may highlight critical instances where attention is disproportionately focused, potentially indicating rare but important features in the data.
- **Log Scale Implications**: The use of logarithmic scales suggests the data spans multiple orders of magnitude, requiring careful interpretation of relative magnitudes rather than absolute values.
This analysis underscores the need for further investigation into why observed attention deviates from expectations, particularly in outlier cases, to improve model interpretability and performance.