## Diagram: Flowchart of Processes
### Overview
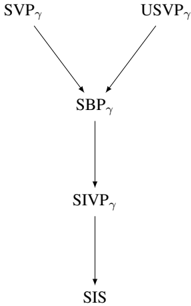
The image is a flowchart illustrating a process that starts with two inputs, SVPγ and USVPγ, converges into SBPγ, then flows through SIVPγ, and finally ends at SIS. The diagram uses arrows to indicate the direction of flow.
### Components/Axes
* **Nodes:**
* SVPγ (top-left)
* USVPγ (top-right)
* SBPγ (center)
* SIVPγ (center, below SBPγ)
* SIS (bottom)
* **Arrows:** Arrows indicate the flow direction from SVPγ and USVPγ to SBPγ, from SBPγ to SIVPγ, and from SIVPγ to SIS.
### Detailed Analysis
* **Flow:** The process begins with two distinct inputs, SVPγ and USVPγ, which both lead into SBPγ. From SBPγ, the process continues to SIVPγ, and finally concludes at SIS.
* **Connections:**
* SVPγ flows into SBPγ.
* USVPγ flows into SBPγ.
* SBPγ flows into SIVPγ.
* SIVPγ flows into SIS.
### Key Observations
* The diagram shows a converging process where two inputs merge into one intermediate stage before proceeding to the final output.
* The diagram is simple and linear after the initial convergence.
### Interpretation
The flowchart represents a process where two separate entities or actions, represented by SVPγ and USVPγ, combine to form SBPγ. This combined entity then undergoes further processing through SIVPγ, ultimately resulting in SIS. The diagram illustrates a clear sequence of steps, indicating how the initial inputs are transformed into the final output. The convergence at SBPγ suggests a critical point where the two inputs are integrated or synthesized.