\n
## Diagram: Flowchart of Gamma-Related Variables
### Overview
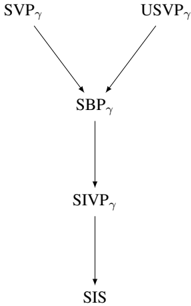
The image depicts a flowchart illustrating the relationships between several variables, all denoted with the subscript γ (gamma). The diagram shows a hierarchical flow from two initial variables converging into a central variable, which then flows sequentially through two more variables. There are no numerical values or scales present; it is a purely conceptual diagram.
### Components/Axes
The diagram consists of five labeled nodes connected by arrows indicating flow direction. The labels are:
* **SVPγ** (Top-left)
* **USVPγ** (Top-right)
* **SBPγ** (Center)
* **SIVPγ** (Lower-center)
* **SIS** (Bottom)
The arrows indicate a flow from SVPγ and USVPγ *to* SBPγ, from SBPγ *to* SIVPγ, and from SIVPγ *to* SIS.
### Detailed Analysis or Content Details
The diagram shows a convergence of two inputs, SVPγ and USVPγ, into a single output, SBPγ. This output then becomes the input for SIVPγ, which in turn feeds into SIS. The diagram does not provide any quantitative information about the relationships between these variables, only their sequential dependencies.
### Key Observations
The diagram suggests a causal or sequential relationship between the variables. SVPγ and USVPγ appear to be independent inputs that contribute to SBPγ. SBPγ then influences SIVPγ, and finally, SIVPγ influences SIS. The diagram is a simplified representation of a process or system.
### Interpretation
This diagram likely represents a simplified model of a system where variables are related through a series of transformations or dependencies. The use of the subscript γ suggests that these variables are related to a specific parameter or condition (gamma). Without further context, it's difficult to determine the specific meaning of these variables. However, the diagram clearly illustrates a flow of information or influence from the initial variables (SVPγ and USVPγ) to the final variable (SIS). The convergence of SVPγ and USVPγ into SBPγ suggests a combining or integrating process. The sequential flow from SBPγ to SIVPγ and then to SIS indicates a chain of events or a series of steps in a process. The diagram is a high-level representation and does not provide details about the nature of the relationships or the specific mechanisms involved. It is a conceptual model, not a quantitative analysis.