## Heatmap: Accuracy Difference between BO and GCN
### Overview
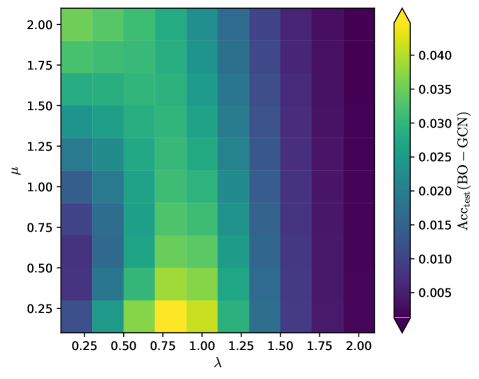
The image is a heatmap visualizing the difference in test accuracy (Acc_test) between a Bayesian Optimization (BO) model and a Graph Convolutional Network (GCN) model, across different values of parameters lambda (λ) and mu (μ). The color intensity represents the magnitude of the accuracy difference, with warmer colors (yellow/green) indicating higher accuracy for BO compared to GCN, and cooler colors (purple/blue) indicating lower accuracy.
### Components/Axes
* **X-axis (Horizontal):** Lambda (λ), ranging from 0.25 to 2.00 in increments of 0.25.
* **Y-axis (Vertical):** Mu (μ), ranging from 0.25 to 2.00 in increments of 0.25.
* **Colorbar (Right):** Represents the value of Acc_test (BO - GCN), ranging from approximately 0.005 (dark purple) to 0.040 (yellow). The colorbar has tick marks at 0.005, 0.010, 0.015, 0.020, 0.025, 0.030, 0.035, and 0.040.
### Detailed Analysis
The heatmap consists of a grid of colored cells, where each cell represents a combination of λ and μ values. The color of each cell indicates the difference in test accuracy between the BO and GCN models for that specific parameter combination.
Here's a breakdown of the data based on visual inspection:
* **λ = 0.25:** The accuracy difference is generally low (purple/blue), indicating that GCN performs similarly or slightly better than BO for most μ values.
* **λ = 0.50:** The accuracy difference starts to increase (greenish), especially for lower μ values (0.25 - 1.00).
* **λ = 0.75:** The accuracy difference is highest (yellow) around μ = 0.25, suggesting that BO significantly outperforms GCN for this parameter combination.
* **λ = 1.00 to 2.00:** The accuracy difference decreases again (purple/blue), indicating that GCN performs similarly or better than BO for these higher λ values, regardless of the μ value.
Specific data points (approximate based on color):
* λ = 0.25, μ = 0.25: Acc_test (BO - GCN) ≈ 0.005
* λ = 0.75, μ = 0.25: Acc_test (BO - GCN) ≈ 0.040
* λ = 2.00, μ = 2.00: Acc_test (BO - GCN) ≈ 0.005
### Key Observations
* The highest accuracy difference (BO outperforming GCN) occurs when λ is around 0.75 and μ is around 0.25.
* As λ increases beyond 1.00, the accuracy difference generally decreases, suggesting that GCN becomes more competitive or even outperforms BO.
* The accuracy difference is relatively low for λ = 0.25 across all μ values.
* The right side of the heatmap (λ > 1.25) is consistently purple/blue, indicating that BO does not perform as well as GCN in this region.
### Interpretation
The heatmap suggests that the relative performance of Bayesian Optimization (BO) and Graph Convolutional Networks (GCN) is highly dependent on the values of parameters λ and μ. Specifically, BO appears to significantly outperform GCN when λ is around 0.75 and μ is around 0.25. However, as λ increases, the performance of BO relative to GCN decreases, and GCN may even outperform BO. This indicates that the choice of λ and μ is crucial for optimizing the performance of either model, and that the optimal parameter values may differ depending on the specific task or dataset. The data suggests that for higher values of lambda, GCN is a better choice.