\n
## Heatmap: Acc_test (BO - GCN) vs. λ and μ
### Overview
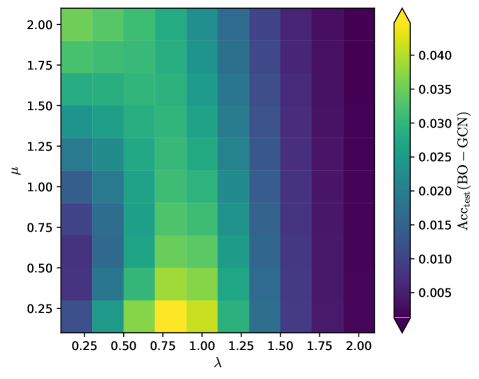
The image presents a heatmap visualizing the relationship between two parameters, λ (lambda) and μ (mu), and their impact on the `Acc_test (BO - GCN)` metric. The heatmap displays a color gradient representing the values of `Acc_test`, with warmer colors (yellow/green) indicating higher values and cooler colors (blue/purple) indicating lower values.
### Components/Axes
* **X-axis:** λ (lambda), ranging from approximately 0.20 to 2.00, with increments of approximately 0.25.
* **Y-axis:** μ (mu), ranging from approximately 0.20 to 2.00, with increments of approximately 0.25.
* **Colorbar:** Located on the right side of the heatmap, representing the `Acc_test (BO - GCN)` values. The scale ranges from approximately 0.005 (dark purple) to 0.040 (bright yellow).
* **Title:** Implicitly, the title is related to the metric being visualized: `Acc_test (BO - GCN)`.
### Detailed Analysis
The heatmap is a 9x9 grid, with each cell representing a unique combination of λ and μ values. The color of each cell corresponds to the `Acc_test` value for that combination.
Here's a breakdown of approximate `Acc_test` values based on color and grid position:
* **λ = 0.25, μ = 0.25:** Approximately 0.007 (dark purple)
* **λ = 0.25, μ = 0.50:** Approximately 0.010 (purple)
* **λ = 0.25, μ = 0.75:** Approximately 0.015 (purple)
* **λ = 0.25, μ = 1.00:** Approximately 0.020 (purple)
* **λ = 0.25, μ = 1.25:** Approximately 0.025 (blue)
* **λ = 0.25, μ = 1.50:** Approximately 0.025 (blue)
* **λ = 0.25, μ = 1.75:** Approximately 0.030 (blue)
* **λ = 0.25, μ = 2.00:** Approximately 0.030 (blue)
* **λ = 0.50, μ = 0.25:** Approximately 0.010 (purple)
* **λ = 0.50, μ = 0.50:** Approximately 0.015 (blue)
* **λ = 0.50, μ = 0.75:** Approximately 0.020 (blue)
* **λ = 0.50, μ = 1.00:** Approximately 0.025 (blue)
* **λ = 0.50, μ = 1.25:** Approximately 0.030 (blue)
* **λ = 0.50, μ = 1.50:** Approximately 0.030 (blue)
* **λ = 0.50, μ = 1.75:** Approximately 0.035 (green)
* **λ = 0.50, μ = 2.00:** Approximately 0.035 (green)
* **λ = 0.75, μ = 0.25:** Approximately 0.015 (blue)
* **λ = 0.75, μ = 0.50:** Approximately 0.020 (blue)
* **λ = 0.75, μ = 0.75:** Approximately 0.025 (blue)
* **λ = 0.75, μ = 1.00:** Approximately 0.030 (blue)
* **λ = 0.75, μ = 1.25:** Approximately 0.035 (green)
* **λ = 0.75, μ = 1.50:** Approximately 0.035 (green)
* **λ = 0.75, μ = 1.75:** Approximately 0.040 (yellow)
* **λ = 0.75, μ = 2.00:** Approximately 0.040 (yellow)
* **λ = 1.00, μ = 0.25:** Approximately 0.020 (blue)
* **λ = 1.00, μ = 0.50:** Approximately 0.025 (blue)
* **λ = 1.00, μ = 0.75:** Approximately 0.030 (blue)
* **λ = 1.00, μ = 1.00:** Approximately 0.035 (green)
* **λ = 1.00, μ = 1.25:** Approximately 0.035 (green)
* **λ = 1.00, μ = 1.50:** Approximately 0.040 (yellow)
* **λ = 1.00, μ = 1.75:** Approximately 0.040 (yellow)
* **λ = 1.00, μ = 2.00:** Approximately 0.040 (yellow)
* **λ = 1.25, μ = 0.25:** Approximately 0.025 (blue)
* **λ = 1.25, μ = 0.50:** Approximately 0.030 (blue)
* **λ = 1.25, μ = 0.75:** Approximately 0.035 (green)
* **λ = 1.25, μ = 1.00:** Approximately 0.035 (green)
* **λ = 1.25, μ = 1.25:** Approximately 0.040 (yellow)
* **λ = 1.25, μ = 1.50:** Approximately 0.040 (yellow)
* **λ = 1.25, μ = 1.75:** Approximately 0.040 (yellow)
* **λ = 1.25, μ = 2.00:** Approximately 0.040 (yellow)
The trend shows that as both λ and μ increase, the `Acc_test` value generally increases, reaching its maximum around λ = 0.75 and μ = 1.75, and remaining high for larger values of λ and μ.
### Key Observations
* The lowest `Acc_test` values are concentrated in the bottom-left corner of the heatmap (low λ and low μ).
* The highest `Acc_test` values are concentrated in the top-right corner (high λ and high μ).
* There appears to be a relatively flat region of high `Acc_test` values when both λ and μ are greater than approximately 1.0.
### Interpretation
The heatmap suggests that the `Acc_test (BO - GCN)` metric is positively correlated with both λ and μ. This implies that increasing the values of these parameters generally improves the test accuracy of the BO-GCN model. The plateau in the top-right corner indicates that there may be a point of diminishing returns, where further increases in λ and μ do not significantly improve accuracy. The model performs poorly when both parameters are low. This visualization is useful for hyperparameter tuning, as it provides a clear indication of the optimal range for λ and μ to maximize test accuracy. The BO-GCN model is sensitive to the values of λ and μ, and careful selection of these parameters is crucial for achieving good performance.