TECHNICAL ASSET FINGERPRINT
f6bb24acc71a63924386e5be
Click to view fullscreen
Press ESC or click to close
FOUND IN PAPERS
EXPERT: healer-alpha-free VERSION 1
RUNTIME: free/openrouter/healer-alpha
INTEL_VERIFIED
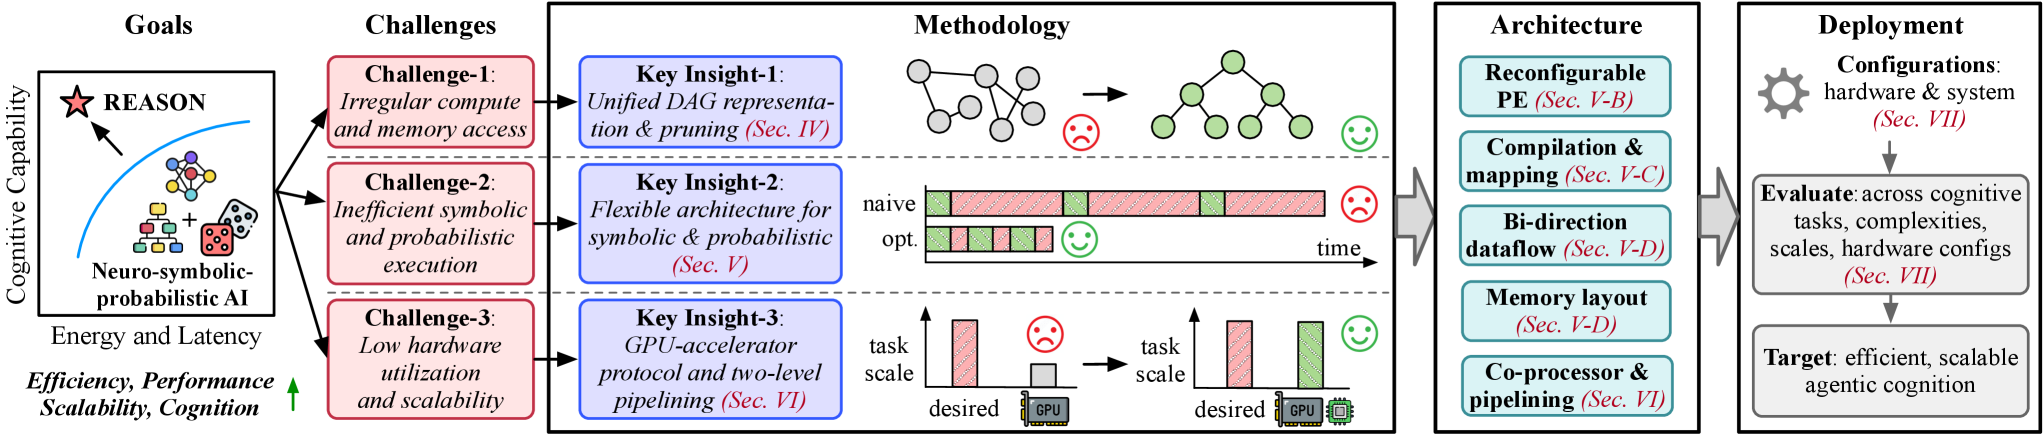
## Diagram: Research Pipeline for Neuro-Symbolic-Probabilistic AI Hardware Acceleration
### Overview
This image is a structured flowchart or research pipeline diagram illustrating the progression from high-level goals to deployment for a specialized AI hardware system. It is divided into five main vertical sections, connected by arrows indicating flow and dependency. The diagram outlines the motivation (Goals), identified problems (Challenges), proposed solutions (Methodology), system design (Architecture), and final application (Deployment) for a project focused on efficient, scalable "agentic cognition."
### Components/Axes
The diagram is organized into five primary columns or sections, from left to right:
1. **Goals (Leftmost Column):**
* **Main Title:** "Goals"
* **Central Graphic:** A box containing a star labeled "REASON" above a cluster of icons representing neural networks, logic symbols, and dice. Below this is the text "Neuro-symbolic-probabilistic AI".
* **Y-Axis Label (Left Side):** "Cognitive Capability" (with an upward-pointing arrow).
* **X-Axis Label (Bottom):** "Energy and Latency" (with a rightward-pointing arrow).
* **Bottom Text:** "Efficiency, Performance, Scalability, Cognition" with a green upward arrow next to it.
2. **Challenges (Second Column):**
* **Main Title:** "Challenges"
* Contains three red-bordered boxes, each listing a specific challenge:
* **Challenge-1:** "Irregular compute and memory access"
* **Challenge-2:** "Inefficient symbolic and probabilistic execution"
* **Challenge-3:** "Low hardware utilization and scalability"
* Arrows connect each challenge box to a corresponding "Key Insight" in the Methodology section.
3. **Methodology (Central, Largest Column):**
* **Main Title:** "Methodology"
* Contains three blue-bordered "Key Insight" boxes, each paired with a visual metaphor diagram to its right.
* **Key Insight-1:** "Unified DAG representation & pruning (Sec. IV)"
* **Diagram:** Shows a messy, irregular directed acyclic graph (DAG) on the left (with a red sad face emoji 😟) transforming into a clean, pruned tree structure on the right (with a green happy face emoji 😊).
* **Key Insight-2:** "Flexible architecture for symbolic & probabilistic (Sec. V)"
* **Diagram:** A timeline comparison. The top "naive" timeline shows long, irregular blocks of pink and green. The bottom "opt." (optimized) timeline shows shorter, more regular, and interleaved blocks. A red sad face 😟 is next to "naive," and a green happy face 😊 is next to "opt." The x-axis is labeled "time".
* **Key Insight-3:** "GPU-accelerator protocol and two-level pipelining (Sec. VI)"
* **Diagram:** Two bar charts comparing "task scale." The left chart shows a tall pink bar ("desired") next to a very short gray bar labeled "GPU" (with a red sad face 😟). The right chart shows the same tall pink bar ("desired") next to a tall green bar, with both a "GPU" icon and a chip icon (with a green happy face 😊).
4. **Architecture (Fourth Column):**
* **Main Title:** "Architecture"
* Contains five teal-bordered boxes listing architectural components:
* "Reconfigurable PE (Sec. V-B)"
* "Compilation & mapping (Sec. V-C)"
* "Bi-direction dataflow (Sec. V-D)"
* "Memory layout (Sec. V-D)"
* "Co-processor & pipelining (Sec. VI)"
* A large gray arrow points from the Methodology section to this Architecture section.
5. **Deployment (Rightmost Column):**
* **Main Title:** "Deployment"
* **Top Element:** A gear icon next to the text "Configurations: hardware & system (Sec. VII)".
* **Middle Element:** A gray box with the text "Evaluate: across cognitive tasks, complexities, scales, hardware configs (Sec. VII)". An arrow points from "Configurations" to this box.
* **Bottom Element:** A gray box with the text "Target: efficient, scalable agentic cognition". An arrow points from "Evaluate" to this box.
* A large gray arrow points from the Architecture section to this Deployment section.
### Detailed Analysis
The diagram presents a linear research and development workflow:
1. **Problem Framing:** The goal is to advance "Neuro-symbolic-probabilistic AI" towards higher "Cognitive Capability" while managing "Energy and Latency." The overarching aims are "Efficiency, Performance, Scalability, Cognition."
2. **Problem Identification:** Three core technical challenges are identified, each linked to a specific inefficiency in current systems (irregular access, inefficient execution, low utilization).
3. **Solution Methodology:** Each challenge is addressed by a corresponding key research insight, which is visually explained:
* Insight 1 tackles irregularity via graph pruning.
* Insight 2 addresses execution inefficiency through architectural flexibility, visualized as optimized scheduling.
* Insight 3 improves utilization and scalability via a specialized protocol and pipelining, visualized as closing the gap between desired and actual task scale.
4. **System Design:** The insights inform the design of a hardware architecture with five key components: a reconfigurable processing element (PE), a compilation/mapping system, bi-directional dataflow, a specialized memory layout, and co-processor/pipelining logic.
5. **Validation & Goal:** The architecture is deployed in various configurations and evaluated across a range of tasks. The final target is to achieve "efficient, scalable agentic cognition."
### Key Observations
* **Visual Metaphors:** The Methodology section uses simple but effective visual metaphors (graph pruning, timeline optimization, bar chart improvement) paired with emotive emojis (😟 to 😊) to quickly convey the benefit of each insight.
* **Section References:** Nearly every text box includes a parenthetical reference to a section in a supporting document (e.g., "Sec. IV", "Sec. V-B"), indicating this diagram is a summary of a more detailed technical paper.
* **Flow Arrows:** The diagram uses two types of arrows: thin black arrows for direct challenge-to-insight mapping, and large gray block arrows for the major phase transitions (Methodology -> Architecture -> Deployment).
* **Color Coding:** Colors are used functionally: red for problems/challenges, blue for insights/methods, teal for architectural components, and gray for deployment phases.
### Interpretation
This diagram is a high-level roadmap for a hardware-software co-design project aimed at a next-generation AI paradigm. It argues that current hardware is inefficient for neuro-symbolic-probabilistic AI due to three fundamental issues. The proposed research program systematically addresses each issue with a specific technical insight, which collectively define a novel computer architecture. The ultimate measure of success is not just raw performance, but the efficient and scalable realization of "agentic cognition"—implying AI systems that can reason, plan, and act autonomously. The heavy referencing of document sections suggests this visual is intended to orient a reader within a complex technical publication, providing a narrative thread from motivation to outcome. The progression from sad to happy faces visually reinforces the core thesis: the proposed methodology and architecture solve the identified pain points.
DECODING INTELLIGENCE...