## Bar Chart: Prediction Flip Rate for Llama Models
### Overview
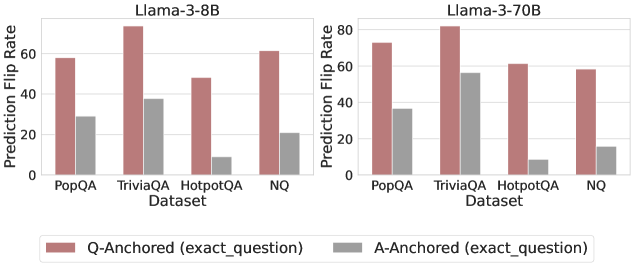
This image presents a comparative bar chart illustrating the prediction flip rate for two Llama models (Llama-3-8B and Llama-3-70B) across four different datasets: PopQA, TriviaQA, HotpotQA, and NQ. The flip rate is measured as a percentage and is shown for both "Q-Anchored (exact_question)" and "A-Anchored (exact_question)" conditions. The chart consists of two sub-charts, one for each Llama model, arranged side-by-side.
### Components/Axes
* **X-axis:** Dataset (PopQA, TriviaQA, HotpotQA, NQ)
* **Y-axis:** Prediction Flip Rate (ranging from 0 to 80)
* **Models:** Llama-3-8B (left chart), Llama-3-70B (right chart)
* **Legend:**
* Red: Q-Anchored (exact\_question)
* Gray: A-Anchored (exact\_question)
### Detailed Analysis
**Llama-3-8B Chart (Left)**
* **PopQA:**
* Q-Anchored: Approximately 62%
* A-Anchored: Approximately 30%
* **TriviaQA:**
* Q-Anchored: Approximately 82%
* A-Anchored: Approximately 42%
* **HotpotQA:**
* Q-Anchored: Approximately 45%
* A-Anchored: Approximately 10%
* **NQ:**
* Q-Anchored: Approximately 68%
* A-Anchored: Approximately 20%
The Q-Anchored bars consistently show higher flip rates than the A-Anchored bars across all datasets. The highest flip rate for this model is observed on the TriviaQA dataset for Q-Anchored.
**Llama-3-70B Chart (Right)**
* **PopQA:**
* Q-Anchored: Approximately 75%
* A-Anchored: Approximately 35%
* **TriviaQA:**
* Q-Anchored: Approximately 88%
* A-Anchored: Approximately 45%
* **HotpotQA:**
* Q-Anchored: Approximately 55%
* A-Anchored: Approximately 15%
* **NQ:**
* Q-Anchored: Approximately 50%
* A-Anchored: Approximately 25%
Similar to the Llama-3-8B chart, the Q-Anchored bars consistently show higher flip rates than the A-Anchored bars across all datasets. The highest flip rate for this model is observed on the TriviaQA dataset for Q-Anchored.
### Key Observations
* The Llama-3-70B model generally exhibits higher prediction flip rates than the Llama-3-8B model across all datasets and anchoring conditions.
* TriviaQA consistently shows the highest prediction flip rates for both models and both anchoring conditions.
* HotpotQA consistently shows the lowest prediction flip rates for both models and both anchoring conditions.
* Q-Anchored consistently has a higher flip rate than A-Anchored.
### Interpretation
The data suggests that the Llama models are more prone to "flipping" their predictions when the question itself is used as the anchor (Q-Anchored) compared to when the answer is used as the anchor (A-Anchored). This could indicate that the models are more sensitive to variations in the question phrasing than variations in the answer. The higher flip rates observed on the TriviaQA dataset might suggest that this dataset presents more challenging or ambiguous questions. The larger Llama-3-70B model demonstrates a greater sensitivity to these anchoring conditions, as evidenced by its higher overall flip rates. This could be due to its increased capacity to model complex relationships within the data, but also potentially indicates a greater susceptibility to overfitting or noise. The consistent pattern across datasets suggests a systematic behavior of the models rather than random fluctuations. The difference in flip rates between Q-Anchored and A-Anchored could be a metric for evaluating the robustness of the models to adversarial attacks or subtle changes in input.