## Grouped Bar Chart: Prediction Flip Rate by Dataset and Anchoring Method for Llama-3 Models
### Overview
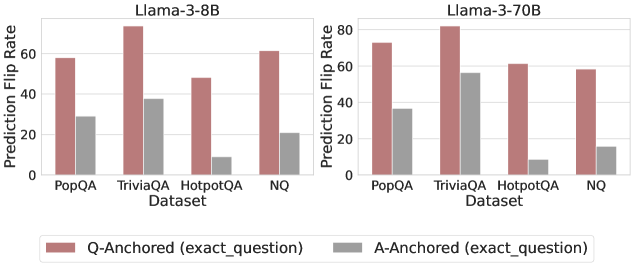
The image displays two side-by-side grouped bar charts comparing the "Prediction Flip Rate" of two language models (Llama-3-8B and Llama-3-70B) across four question-answering datasets. The comparison is between two anchoring methods: "Q-Anchored (exact_question)" and "A-Anchored (exact_question)".
### Components/Axes
* **Chart Titles (Top Center):**
* Left Chart: `Llama-3-8B`
* Right Chart: `Llama-3-70B`
* **Y-Axis (Vertical, Left of each chart):**
* Label: `Prediction Flip Rate`
* Scale: 0 to 80, with major tick marks at 0, 20, 40, 60, 80.
* **X-Axis (Horizontal, Bottom of each chart):**
* Label: `Dataset`
* Categories (from left to right): `PopQA`, `TriviaQA`, `HotpotQA`, `NQ`.
* **Legend (Bottom Center, spanning both charts):**
* A reddish-brown square: `Q-Anchored (exact_question)`
* A gray square: `A-Anchored (exact_question)`
### Detailed Analysis
**Llama-3-8B Chart (Left):**
* **Trend Verification:** For all four datasets, the Q-Anchored (reddish-brown) bar is significantly taller than the A-Anchored (gray) bar, indicating a higher flip rate.
* **Data Points (Approximate Values):**
* **PopQA:** Q-Anchored ≈ 58, A-Anchored ≈ 29.
* **TriviaQA:** Q-Anchored ≈ 75 (highest in this chart), A-Anchored ≈ 38.
* **HotpotQA:** Q-Anchored ≈ 48, A-Anchored ≈ 9 (lowest in this chart).
* **NQ:** Q-Anchored ≈ 62, A-Anchored ≈ 21.
**Llama-3-70B Chart (Right):**
* **Trend Verification:** Similar to the 8B model, the Q-Anchored bar is taller than the A-Anchored bar for every dataset. The overall flip rates for Q-Anchored appear slightly higher than for the 8B model.
* **Data Points (Approximate Values):**
* **PopQA:** Q-Anchored ≈ 73, A-Anchored ≈ 36.
* **TriviaQA:** Q-Anchored ≈ 81 (highest in the entire image), A-Anchored ≈ 56.
* **HotpotQA:** Q-Anchored ≈ 61, A-Anchored ≈ 9 (lowest in this chart, similar to 8B).
* **NQ:** Q-Anchored ≈ 58, A-Anchored ≈ 15.
### Key Observations
1. **Consistent Anchoring Effect:** Across both model sizes and all four datasets, the "Q-Anchored (exact_question)" method consistently results in a higher Prediction Flip Rate than the "A-Anchored (exact_question)" method.
2. **Model Size Impact:** The larger Llama-3-70B model generally exhibits higher flip rates for the Q-Anchored method compared to the Llama-3-8B model (e.g., PopQA: ~73 vs ~58, TriviaQA: ~81 vs ~75). The effect on A-Anchored rates is less consistent.
3. **Dataset Variability:** The "TriviaQA" dataset shows the highest flip rates for both models under Q-Anchoring. The "HotpotQA" dataset shows the lowest flip rates for A-Anchoring in both models.
4. **Relative Gap:** The absolute difference (gap) between Q-Anchored and A-Anchored flip rates is largest for "TriviaQA" in both models and smallest for "HotpotQA".
### Interpretation
This chart investigates the stability of model predictions when the input is anchored to either the exact question (Q-Anchored) or the exact answer (A-Anchored). A higher "Prediction Flip Rate" suggests the model's output is more sensitive to changes in the input context when anchored to the question versus the answer.
The data strongly suggests that **anchoring to the exact question makes model predictions significantly more volatile** (prone to flipping) than anchoring to the exact answer. This pattern holds regardless of model scale (8B vs 70B parameters). The increased volatility with question-anchoring might indicate that models rely more heavily on the precise phrasing of the question to generate an answer, whereas answer-anchoring provides a more stable reference point. The particularly high flip rate on TriviaQA could imply that this dataset contains questions where phrasing is especially critical or where multiple valid answer formulations exist, making the model's output highly dependent on the exact question wording. The consistent, low flip rate for A-Anchored on HotpotQA suggests that for this multi-hop reasoning dataset, once the answer is fixed, the model's reasoning path is relatively stable.