## Bar Chart: Prediction Flip Rate Comparison for Llama-3-8B and Llama-3-70B Models
### Overview
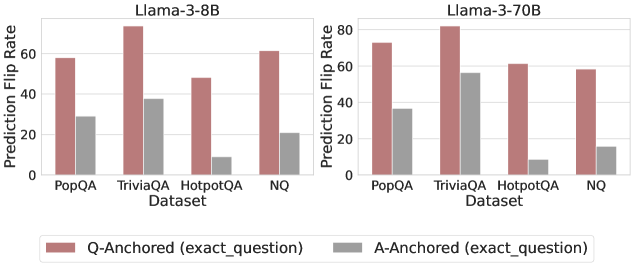
The image presents a comparative bar chart analyzing prediction flip rates for two language models (Llama-3-8B and Llama-3-70B) across four question-answering datasets (PopQA, TriviaQA, HotpotQA, NQ). Two anchoring strategies are compared: Q-Anchored (exact_question) and A-Anchored (exact_question), represented by red and gray bars respectively.
### Components/Axes
- **X-Axis (Datasets)**: PopQA, TriviaQA, HotpotQA, NQ (categorical, evenly spaced)
- **Y-Axis (Prediction Flip Rate)**: 0–80 scale (linear, increments of 20)
- **Legend**:
- Red: Q-Anchored (exact_question)
- Gray: A-Anchored (exact_question)
- **Model Sections**:
- Left: Llama-3-8B
- Right: Llama-3-70B
### Detailed Analysis
#### Llama-3-8B (Left Section)
- **Q-Anchored (Red)**:
- PopQA: ~60
- TriviaQA: ~70
- HotpotQA: ~50
- NQ: ~60
- **A-Anchored (Gray)**:
- PopQA: ~30
- TriviaQA: ~40
- HotpotQA: ~10
- NQ: ~20
#### Llama-3-70B (Right Section)
- **Q-Anchored (Red)**:
- PopQA: ~70
- TriviaQA: ~80
- HotpotQA: ~60
- NQ: ~55
- **A-Anchored (Gray)**:
- PopQA: ~40
- TriviaQA: ~50
- HotpotQA: ~10
- NQ: ~15
### Key Observations
1. **Q-Anchored Consistently Outperforms A-Anchored**:
- For both models, Q-Anchored rates are 2–4x higher than A-Anchored across all datasets.
- Largest gap in HotpotQA (Llama-3-8B: 50 vs 10; Llama-3-70B: 60 vs 10).
2. **Model Size Impact**:
- Llama-3-70B generally achieves higher rates than Llama-3-8B (e.g., TriviaQA: 80 vs 70 for Q-Anchored).
- NQ dataset shows the largest performance drop for Llama-3-70B (55 vs 60 for Q-Anchored).
3. **Dataset Variability**:
- TriviaQA and PopQA show the highest performance for both models.
- NQ dataset has the lowest rates overall, suggesting potential challenges in this domain.
### Interpretation
The data demonstrates that anchoring models to exact questions (Q-Anchored) significantly improves prediction flip rates compared to answer anchoring (A-Anchored). This suggests that question-level context is more critical for accurate predictions than answer-level context. The performance gap widens in complex datasets like HotpotQA, where multi-hop reasoning may require deeper question understanding. While larger models (70B) generally outperform smaller ones (8B), the NQ dataset reveals a notable exception, indicating potential limitations in handling specific question types despite increased model capacity. These findings highlight the importance of anchoring strategies and dataset-specific model tuning for question-answering systems.