## Line Graphs: Eigenvalue Decay and Effective Dimension Trends
### Overview
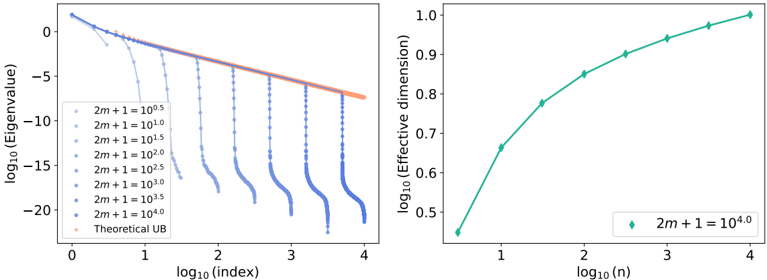
The image contains two side-by-side graphs. The left graph is a log-log plot showing eigenvalue decay across indices for different system sizes, with a theoretical upper bound (UB). The right graph is a line plot showing the relationship between effective dimension and system size (n).
### Components/Axes
**Left Graph (Eigenvalue Decay):**
- **X-axis**: `log₁₀(index)` ranging from 0 to 4
- **Y-axis**: `log₁₀(eigenvalue)` ranging from -20 to 0
- **Legend**: Located at bottom-left, with entries:
- Blue dots: `2m + 1 = 10⁰.⁵, 10¹.⁰, 10¹.⁵, 10².⁰, 10².⁵, 10³.⁰, 10³.⁵, 10⁴.⁰`
- Red line: `Theoretical UB`
- **Data Points**: Blue dots with vertical error bars, connected by dashed lines to the x-axis.
**Right Graph (Effective Dimension):**
- **X-axis**: `log₁₀(n)` ranging from 1 to 4
- **Y-axis**: `log₁₀(effective dimension)` ranging from 0.5 to 1.0
- **Legend**: Located at bottom-right, with entry:
- Green diamonds: `2m + 1 = 10⁴.⁰`
- **Data Points**: Green diamonds connected by a solid line.
### Detailed Analysis
**Left Graph Trends:**
- All blue data series show a **downward slope** in log-log space, indicating exponential decay of eigenvalues with increasing index.
- The `2m + 1 = 10⁴.⁰` series (darkest blue) has the slowest decay, with eigenvalues reaching ~-15 at index 4.
- The `2m + 1 = 10⁰.⁵` series (lightest blue) decays most rapidly, reaching ~-20 at index 4.
- The **Theoretical UB** (red line) is a straight diagonal line with a slope of -1, serving as an asymptotic boundary for all series.
**Right Graph Trends:**
- The green line shows a **steady upward trend** in log-log space, indicating sublinear growth of effective dimension with system size.
- At `log₁₀(n) = 1` (n=10), effective dimension ≈ 0.5.
- At `log₁₀(n) = 4` (n=10,000), effective dimension approaches 1.0.
- The curve suggests a **saturation effect**, where effective dimension plateaus near 1 as n increases.
### Key Observations
1. **Eigenvalue Decay**: Larger system sizes (`2m + 1`) exhibit slower eigenvalue decay, consistent with the theoretical UB.
2. **Effective Dimension**: The logarithmic relationship implies the system's dimensionality grows sublinearly with size, approaching a fixed value.
3. **Convergence**: The right graph's saturation at effective dimension ≈1.0 may indicate a fundamental limit in the modeled system.
### Interpretation
The left graph demonstrates that eigenvalues decay exponentially with index, with larger systems (`2m + 1`) approaching the theoretical UB more closely. This suggests the UB represents an optimal or maximum decay rate for the system. The right graph reveals that effective dimension grows logarithmically with system size but saturates near 1.0, implying the system's complexity or representational capacity stabilizes despite increasing size. These trends could reflect properties of matrix factorizations, neural network representations, or other high-dimensional systems where dimensionality and eigenvalue spectra are critical metrics.