# Technical Document Extraction: Network Flow Processing Workflow
## Diagram Description
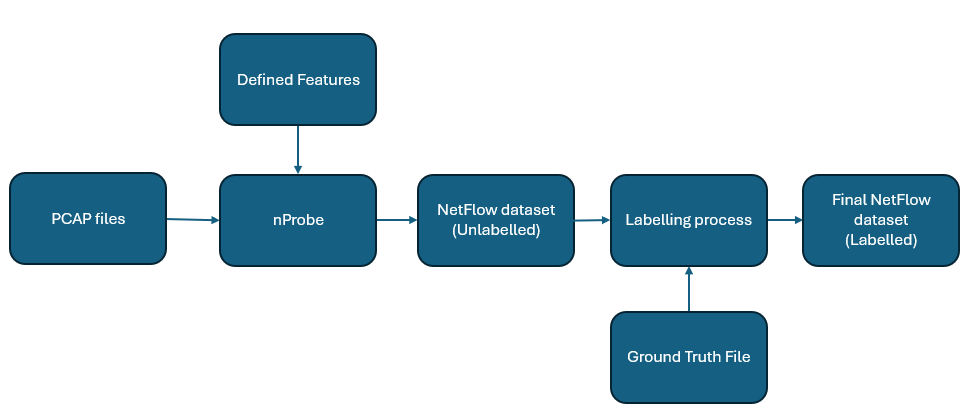
The image depicts a sequential data processing workflow for network traffic analysis. The flowchart consists of six interconnected components with directional arrows indicating data flow. All components are represented as dark blue rounded rectangles with white text labels.
## Component Analysis
1. **PCAP files** (Leftmost component)
- Input source for the workflow
- Contains raw network packet capture data
2. **nProbe** (Second component)
- Network monitoring tool
- Processes PCAP files using Defined Features
- Output: Unlabelled NetFlow dataset
3. **Defined Features** (Top component)
- Configuration parameters for nProbe
- Positioned above nProbe with downward arrow connection
4. **NetFlow dataset (Unlabelled)** (Third component)
- Intermediate output from nProbe
- Contains processed network flow data without classification
5. **Labelling process** (Fourth component)
- Classification stage
- Receives input from:
- Unlabelled NetFlow dataset
- Ground Truth File (via bidirectional arrow)
- Output: Final Labelled dataset
6. **Ground Truth File** (Bottom component)
- Reference dataset for supervised learning
- Connected bidirectionally to Labelling process
7. **Final NetFlow dataset (Labelled)** (Rightmost component)
- End product of the workflow
- Contains classified network flow data
## Flowchart Structure
- Horizontal progression from left to right
- Vertical connection between Ground Truth File and Labelling process
- All components connected by single-direction arrows except:
- Bidirectional connection between Ground Truth File and Labelling process
## Textual Content
All components contain the following text labels:
1. "PCAP files"
2. "nProbe"
3. "Defined Features"
4. "NetFlow dataset (Unlabelled)"
5. "Labelling process"
6. "Ground Truth File"
7. "Final NetFlow dataset (Labelled)"
## Process Flow
1. PCAP files → nProbe (using Defined Features)
2. nProbe → Unlabelled NetFlow dataset
3. Unlabelled dataset + Ground Truth File → Labelling process
4. Labelling process → Final Labelled dataset
## Technical Notes
- No numerical data or quantitative metrics present
- All connections use standard flowchart arrow notation
- Color scheme: Dark blue (#003366) background with white text
- No legends, axis titles, or numerical scales present
- No secondary languages detected
## Workflow Purpose
This diagram illustrates a supervised machine learning pipeline for network traffic classification, where raw PCAP data is processed through nProbe, enriched with defined features, and then classified using ground truth references to produce a labeled dataset for further analysis.