## Scatter Plot: Effective Synaptic Operations vs. $R^2$
### Overview
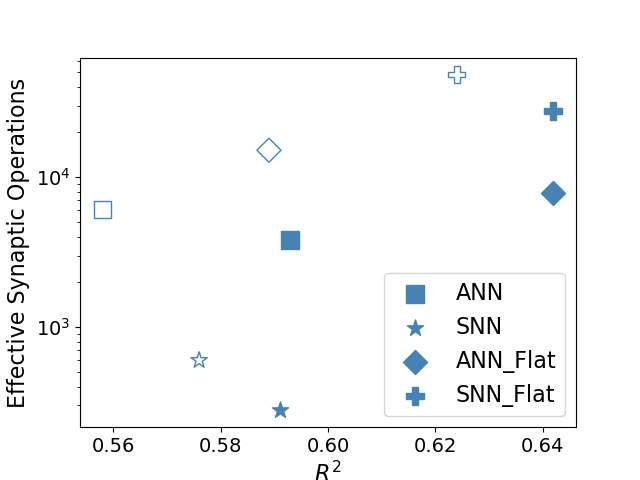
This image is a scatter plot visualizing the trade-off between model performance (measured by $R^2$) and computational cost (measured by "Effective Synaptic Operations"). The plot compares four distinct model architectures: ANN, SNN, ANN_Flat, and SNN_Flat. The Y-axis uses a logarithmic scale.
### Components/Axes
* **X-Axis:** Labeled "$R^2$". The scale ranges from 0.56 to 0.64.
* **Y-Axis:** Labeled "Effective Synaptic Operations". The scale is logarithmic, spanning from $10^3$ to $10^4$ (and extending beyond $10^4$).
* **Legend:** Located in the bottom-right quadrant. It defines four marker types:
* **Square (filled):** ANN
* **Star (filled):** SNN
* **Diamond (filled):** ANN_Flat
* **Plus (filled):** SNN_Flat
* **Note on Markers:** The plot contains both filled and hollow versions of these shapes. The legend only provides keys for the filled versions; the distinction between hollow and filled markers is not explicitly defined in the image.
### Detailed Analysis
The following data points are estimated based on the visual positioning relative to the axes:
| Model Type | Marker Style | Approx. $R^2$ (X) | Approx. Synaptic Ops (Y) |
| :--- | :--- | :--- | :--- |
| **ANN** | Hollow Square | 0.56 | ~6,000 |
| **ANN** | Filled Square | 0.59 | ~4,000 |
| **SNN** | Hollow Star | 0.575 | ~600 |
| **SNN** | Filled Star | 0.59 | ~300 |
| **ANN_Flat** | Hollow Diamond | 0.59 | ~15,000 |
| **ANN_Flat** | Filled Diamond | 0.64 | ~8,000 |
| **SNN_Flat** | Hollow Plus | 0.625 | ~40,000 |
| **SNN_Flat** | Filled Plus | 0.64 | ~25,000 |
### Key Observations
* **Computational Cost Hierarchy:** The "Flat" variants (Diamond and Plus) consistently occupy the upper region of the chart, indicating significantly higher "Effective Synaptic Operations" compared to the standard ANN and SNN models.
* **Efficiency Gap:** SNN (Star) models are positioned at the lowest Y-values, suggesting they are the most computationally efficient architectures among those plotted.
* **Performance vs. Cost:** There is a general trend where higher $R^2$ values (moving right on the X-axis) correlate with higher computational costs (moving up on the Y-axis), particularly when comparing the "Flat" models to the standard models.
* **Ambiguous Variable:** The distinction between hollow and filled markers is consistent across all four categories (each has one hollow and one filled marker). This suggests a secondary variable (e.g., training vs. testing data, or different hyperparameter configurations) that is not labeled in the legend.
### Interpretation
This chart demonstrates a classic Pareto-style trade-off analysis in neural network architecture design.
1. **Efficiency vs. Accuracy:** The data suggests that while "Flat" architectures (ANN_Flat, SNN_Flat) achieve higher $R^2$ scores (approaching 0.64), they do so at a substantial computational cost, requiring an order of magnitude more synaptic operations than their standard counterparts.
2. **SNN Advantage:** The SNN models appear to be the most efficient, operating well below the $10^3$ threshold, though they also appear to have lower $R^2$ scores compared to the "Flat" variants.
3. **Missing Context:** The presence of both hollow and filled markers without a legend definition is a significant omission. Given the consistent pairing (one hollow, one filled per category), it is highly probable that these represent two different experimental conditions (e.g., "Training" vs. "Inference" or "Model A" vs. "Model B"). Without this key, the full relationship between the data points cannot be definitively determined.