\n
## Scatter Plot: Neural Network Model Performance vs. Computational Cost
### Overview
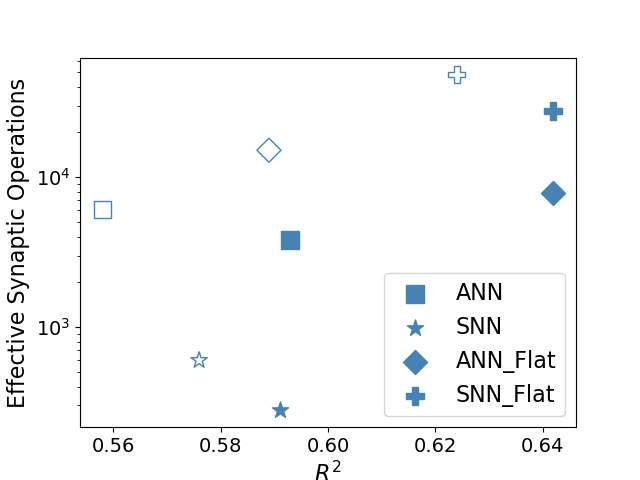
This image is a scatter plot comparing four types of neural network models based on two metrics: their coefficient of determination (R²) on the x-axis and their "Effective Synaptic Operations" on a logarithmic scale on the y-axis. The plot visualizes a trade-off between model fit (R²) and computational complexity.
### Components/Axes
* **X-Axis:** Labeled "R²". The scale is linear, with major tick marks at 0.56, 0.58, 0.60, 0.62, and 0.64.
* **Y-Axis:** Labeled "Effective Synaptic Operations". The scale is logarithmic (base 10), with major tick marks at 10³ and 10⁴. The visible range extends from approximately 2x10² to 5x10⁴.
* **Legend:** Located in the bottom-right quadrant of the chart area. It defines four data series, all using blue markers of different shapes:
* **ANN:** Represented by a square (■).
* **SNN:** Represented by a star (★).
* **ANN_Flat:** Represented by a diamond (◆).
* **SNN_Flat:** Represented by a plus sign (✚).
* **Data Points:** Each series has two data points: one rendered as an **open** (unfilled) shape and one as a **filled** shape. The legend does not specify the meaning of this fill distinction.
### Detailed Analysis
**Data Series and Approximate Coordinates:**
The following table lists each data point, identified by its series and fill style, with approximate coordinates read from the chart.
| Series (Marker) | Fill Style | Approx. R² | Approx. Effective Synaptic Operations |
| :--- | :--- | :--- | :--- |
| **ANN (Square)** | Open | 0.56 | 6,000 |
| **ANN (Square)** | Filled | 0.59 | 4,000 |
| **SNN (Star)** | Open | 0.575 | 600 |
| **SNN (Star)** | Filled | 0.59 | 200 |
| **ANN_Flat (Diamond)** | Open | 0.59 | 15,000 |
| **ANN_Flat (Diamond)** | Filled | 0.64 | 8,000 |
| **SNN_Flat (Plus)** | Open | 0.625 | 50,000 |
| **SNN_Flat (Plus)** | Filled | 0.64 | 30,000 |
**Trend Verification:**
* **ANN (Squares):** The line connecting the two points slopes slightly downward. As R² increases from 0.56 to 0.59, the synaptic operations decrease from ~6,000 to ~4,000.
* **SNN (Stars):** The line slopes downward. As R² increases from 0.575 to 0.59, synaptic operations decrease from ~600 to ~200.
* **ANN_Flat (Diamonds):** The line slopes downward. As R² increases from 0.59 to 0.64, synaptic operations decrease from ~15,000 to ~8,000.
* **SNN_Flat (Pluses):** The line slopes downward. As R² increases from 0.625 to 0.64, synaptic operations decrease from ~50,000 to ~30,000.
**Spatial Grounding:** The legend is positioned in the bottom-right, overlapping slightly with the chart's white space but not obscuring any data points. All data points are clearly visible within the plot area defined by the axes.
### Key Observations
1. **Performance Hierarchy:** The "Flat" variants (ANN_Flat, SNN_Flat) achieve significantly higher R² values (up to 0.64) compared to their standard counterparts (ANN, SNN, max R² ~0.59).
2. **Cost Hierarchy:** The "Flat" variants also incur a much higher computational cost. SNN_Flat is the most expensive, with operations in the tens of thousands. SNN is the least expensive, with operations in the hundreds.
3. **Trade-off Direction:** For all four model types, the data point with the **higher R²** has **fewer** effective synaptic operations. This suggests that within each model class, the configuration that yields better fit is also more computationally efficient.
4. **Fill Pattern:** For every series, the **filled** marker corresponds to the data point with the **higher R²** and **lower** synaptic operations compared to its open-marker counterpart.
### Interpretation
The chart demonstrates a clear relationship between model architecture, predictive performance (R²), and computational cost (synaptic operations).
* **Architectural Impact:** Moving from a standard to a "Flat" architecture (the meaning of "Flat" is not defined in the image) dramatically increases both the potential model fit (higher R²) and the computational resources required. This suggests "Flat" models are more complex.
* **Efficiency Frontier:** The downward slope for each series indicates that optimization within a given architecture can improve both performance and efficiency simultaneously. The filled markers likely represent an optimized or final version of the model, while the open markers may represent a baseline or initial state.
* **SNN vs. ANN:** Spiking Neural Networks (SNN) consistently operate at a lower synaptic operation count than their Artificial Neural Network (ANN) counterparts for a given R² range, highlighting a potential efficiency advantage of SNNs. However, the highest overall performance (R²=0.64) is achieved by both ANN_Flat and SNN_Flat, with SNN_Flat requiring more operations to reach that same R².
* **Overall Message:** The data suggests that achieving top-tier predictive performance (R² ≈ 0.64) necessitates a significant increase in computational cost, on the order of 10x to 100x more operations than lower-performing models. The choice between ANN_Flat and SNN_Flat at this performance level would involve a trade-off between the specific operational characteristics of each architecture and their associated costs.