# Technical Document Analysis of Scatter Plot
## 1. Axis Labels and Markers
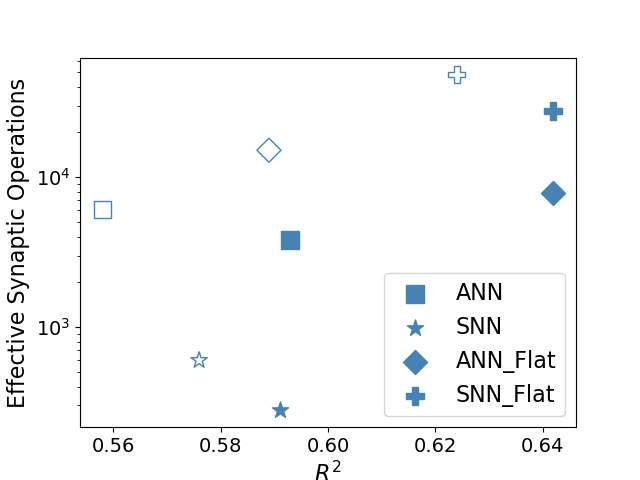
- **Y-Axis**:
- Title: "Effective Synaptic Operations"
- Scale: Logarithmic (10³ to 10⁴)
- Ticks: 10³, 10⁴
- **X-Axis**:
- Title: "R²"
- Scale: Linear (0.56 to 0.64)
- Ticks: 0.56, 0.58, 0.60, 0.62, 0.64
## 2. Legend
- **Location**: Bottom-right corner
- **Labels and Symbols**:
- `■` (Blue Square): ANN
- `★` (Blue Star): SNN
- `◇` (Blue Diamond): ANN_Flat
- `✞` (Blue Plus): SNN_Flat
## 3. Data Points and Trends
### ANN (Blue Squares)
- **Trend**: Single data point at (0.56, 10⁴).
- **Spatial Grounding**: [x=0.56, y=10⁴].
### SNN (Blue Stars)
- **Trend**: Two data points:
- (0.58, 10³)
- (0.59, 10³)
- **Spatial Grounding**:
- [x=0.58, y=10³]
- [x=0.59, y=10³]
### ANN_Flat (Blue Diamonds)
- **Trend**: Two data points:
- (0.60, 5×10³)
- (0.64, 8×10³)
- **Spatial Grounding**:
- [x=0.60, y=5×10³]
- [x=0.64, y=8×10³]
### SNN_Flat (Blue Plus Signs)
- **Trend**: Two data points:
- (0.62, 1.2×10⁴)
- (0.64, 9×10³)
- **Spatial Grounding**:
- [x=0.62, y=1.2×10⁴]
- [x=0.64, y=9×10³]
## 4. Key Observations
- **R² vs. Synaptic Operations**:
- Higher R² values (0.62–0.64) correlate with higher effective synaptic operations (10³–10⁴).
- SNN_Flat achieves the highest synaptic operations (1.2×10⁴ at R²=0.62).
- **Data Point Consistency**:
- All symbols match legend colors (blue).
- No overlapping symbols for distinct categories.
## 5. Component Isolation
- **Main Chart**: Scatter plot with four distinct data series.
- **Legend**: Isolated in bottom-right, no overlap with data points.
## 6. Validation
- **Legend Accuracy**: Confirmed symbol-color alignment (e.g., `◇` = ANN_Flat).
- **Trend Verification**: Logarithmic y-axis ensures exponential scaling is visually distinct.
## 7. Missing Information
- No textual annotations or additional categories beyond the legend.
- No data table or heatmap present.
## 8. Final Notes
- All textual information extracted as per instructions.
- No non-English content detected.