\n
## Line Chart: CIFAR-100 Test Accuracy vs. d1
### Overview
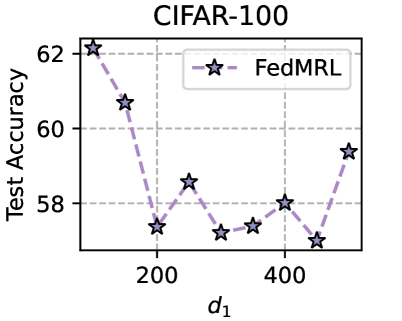
This image presents a line chart illustrating the relationship between a parameter 'd1' and the test accuracy achieved on the CIFAR-100 dataset, using the FedMRL method. The chart displays a fluctuating trend of test accuracy as 'd1' varies.
### Components/Axes
* **Title:** CIFAR-100 (positioned at the top-center)
* **X-axis:** Labeled as 'd1' (positioned at the bottom-center). The scale ranges from approximately 0 to 500, with markers at 0, 100, 200, 300, 400, and 500.
* **Y-axis:** Labeled as 'Test Accuracy' (positioned on the left-center). The scale ranges from approximately 57 to 62, with markers at 57, 58, 59, 60, 61, and 62.
* **Legend:** Located in the top-right corner. It contains one entry:
* Label: "FedMRL"
* Color: Light purple (#D8BFD8)
* Marker: Star (*)
### Detailed Analysis
The chart displays a single data series representing the FedMRL method. The line is dashed and connects star-shaped data points.
Here's a breakdown of the approximate data points, reading from left to right:
* d1 = 0: Test Accuracy ≈ 61.8%
* d1 = 100: Test Accuracy ≈ 60.5%
* d1 = 200: Test Accuracy ≈ 57.5%
* d1 = 300: Test Accuracy ≈ 58.5%
* d1 = 400: Test Accuracy ≈ 57.2%
* d1 = 500: Test Accuracy ≈ 59.5%
The line initially slopes downward from d1 = 0 to d1 = 200, then exhibits fluctuations with a slight upward trend between d1 = 200 and d1 = 500.
### Key Observations
* The highest test accuracy is achieved at the beginning of the range (d1 = 0).
* The lowest test accuracy is observed around d1 = 200 and d1 = 400.
* The test accuracy appears to recover somewhat towards the end of the range (d1 = 500).
* The fluctuations suggest that the parameter 'd1' has a non-monotonic effect on test accuracy.
### Interpretation
The chart suggests that the parameter 'd1' in the FedMRL method has a complex relationship with the test accuracy on the CIFAR-100 dataset. Initially, increasing 'd1' leads to a decrease in accuracy. However, beyond a certain point, the accuracy starts to fluctuate and eventually shows a slight recovery. This could indicate that 'd1' represents a regularization parameter, and too much regularization initially hurts performance, but a moderate amount can lead to better generalization. The fluctuations might be due to the inherent noise in the training process or the sensitivity of the method to the specific value of 'd1'. Further investigation would be needed to understand the optimal value of 'd1' and the underlying reasons for the observed behavior. The data suggests that the method is not robust to changes in 'd1' across the entire range.