## Line Chart: CIFAR-100 Test Accuracy vs. d₁
### Overview
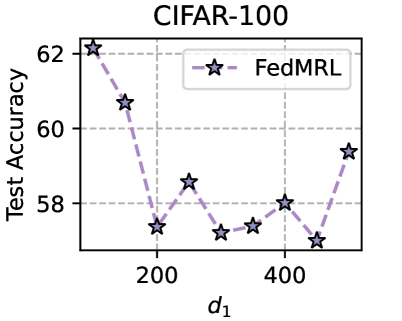
The chart illustrates the relationship between a parameter `d₁` and test accuracy for the FedMRL algorithm on the CIFAR-100 dataset. Test accuracy is plotted on the y-axis (58–62), while `d₁` values (200, 400, 600) are on the x-axis. The data is represented by a dashed purple line with star markers.
### Components/Axes
- **Title**: "CIFAR-100" (top-center).
- **X-axis**: Labeled `d₁`, with tick marks at 200, 400, and 600.
- **Y-axis**: Labeled "Test Accuracy", scaled from 58 to 62.
- **Legend**: Located in the top-right corner, labeled "FedMRL" with a purple dashed line and star markers.
- **Data Series**: A single line (purple dashed) with star markers (black outline, purple fill).
### Detailed Analysis
- **Data Points**:
- At `d₁ = 200`: Test accuracy ≈ 62 (peak).
- At `d₁ = 400`: Test accuracy ≈ 58 (trough).
- At `d₁ = 600`: Test accuracy ≈ 59 (partial recovery).
- **Trend**: The line starts at a high accuracy (62) at `d₁ = 200`, sharply declines to 58 at `d₁ = 400`, then slightly increases to 59 at `d₁ = 600`.
### Key Observations
1. **Initial Peak**: The highest accuracy (62) occurs at the smallest `d₁` value (200).
2. **Significant Dip**: A sharp drop to 58 at `d₁ = 400` suggests sensitivity to parameter increases.
3. **Partial Recovery**: A modest rise to 59 at `d₁ = 600` indicates potential non-linear behavior.
### Interpretation
The data suggests that FedMRL's performance on CIFAR-100 is highly dependent on `d₁`. The initial peak at `d₁ = 200` may reflect optimal parameter settings, while the subsequent drop at `d₁ = 400` highlights a critical threshold where performance degrades. The partial recovery at `d₁ = 600` could imply a secondary optimal region or a stabilizing effect at higher values. This non-linear trend underscores the importance of fine-tuning `d₁` for FedMRL in CIFAR-100 applications. The anomaly at `d₁ = 600` warrants further investigation to determine if it represents a local maximum or a transitional phase.