## Line Chart: Top-1 Accuracy vs. Representation Size
### Overview
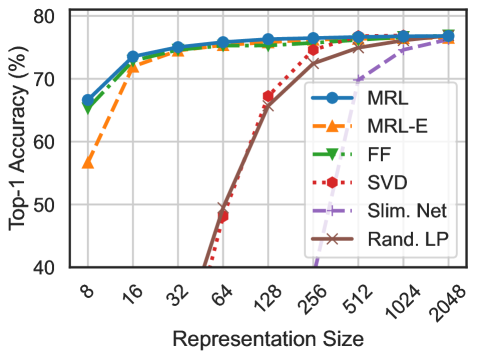
The image is a line chart comparing the Top-1 Accuracy (%) of different models (MRL, MRL-E, FF, SVD, Slim. Net, and Rand. LP) against varying Representation Sizes. The x-axis represents the Representation Size, while the y-axis represents the Top-1 Accuracy in percentage.
### Components/Axes
* **X-axis:** Representation Size, with values 8, 16, 32, 64, 128, 256, 512, 1024, and 2048.
* **Y-axis:** Top-1 Accuracy (%), with values ranging from 40 to 80, in increments of 10.
* **Legend:** Located on the right side of the chart, it identifies each model with a specific color and marker:
* MRL (Blue, Circle marker)
* MRL-E (Orange, Triangle marker)
* FF (Green, Triangle marker pointing to the right)
* SVD (Red, Circle marker)
* Slim. Net (Purple, Plus marker)
* Rand. LP (Brown, X marker)
### Detailed Analysis
* **MRL (Blue, Circle marker):** The line starts at approximately 66% accuracy at a representation size of 8, increases to about 74% at 16, reaches around 76% at 32, and plateaus around 77% for representation sizes 64 and above.
* **MRL-E (Orange, Triangle marker):** The line starts at approximately 56% accuracy at a representation size of 8, increases to about 72% at 16, reaches around 75% at 32, and plateaus around 76% for representation sizes 64 and above.
* **FF (Green, Triangle marker pointing to the right):** The line starts at approximately 66% accuracy at a representation size of 8, increases to about 74% at 16, reaches around 76% at 32, and plateaus around 77% for representation sizes 64 and above.
* **SVD (Red, Circle marker):** The line starts at approximately 48% accuracy at a representation size of 64, increases to about 67% at 128, reaches around 73% at 256, and plateaus around 76% for representation sizes 512 and above.
* **Slim. Net (Purple, Plus marker):** The line starts at approximately 40% accuracy at a representation size of 256, increases to about 75% at 1024, and plateaus around 76% for representation sizes 2048.
* **Rand. LP (Brown, X marker):** The line starts at approximately 40% accuracy at a representation size of 64, increases to about 72% at 256, and plateaus around 76% for representation sizes 512 and above.
### Key Observations
* MRL, MRL-E, and FF models achieve relatively high accuracy even at smaller representation sizes (8-32).
* SVD and Rand. LP models show a significant increase in accuracy as the representation size increases from 64 to 256.
* Slim. Net model shows a significant increase in accuracy as the representation size increases from 256 to 1024.
* All models tend to plateau in accuracy as the representation size increases beyond 256.
### Interpretation
The chart illustrates the relationship between representation size and Top-1 accuracy for different models. It suggests that increasing the representation size generally improves accuracy, but the improvement diminishes beyond a certain point. The models MRL, MRL-E, and FF appear to be more effective at smaller representation sizes compared to SVD, Slim. Net, and Rand. LP. The plateauing effect indicates that there is a limit to how much accuracy can be gained by simply increasing the representation size, and other factors may become more important for further improvement.