## Line Chart: Top-1 Accuracy vs. Representation Size
### Overview
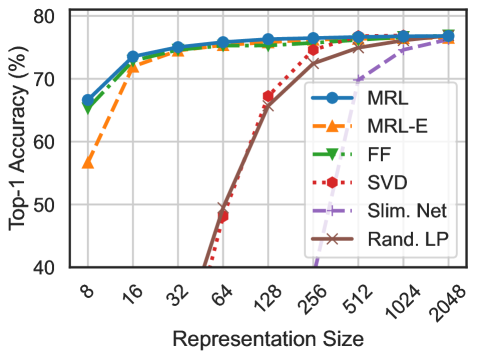
This line chart depicts the relationship between "Representation Size" and "Top-1 Accuracy" for six different models: MRL, MRL-E, FF, SVD, Slim. Net, and Rand. LP. The chart illustrates how the accuracy of each model changes as the size of the representation increases.
### Components/Axes
* **X-axis:** "Representation Size" - Scale ranges from 8 to 2048, with markers at 8, 16, 32, 64, 128, 256, 512, 1024, and 2048.
* **Y-axis:** "Top-1 Accuracy (%)" - Scale ranges from 40% to 80%, with markers at 40, 50, 60, 70, and 80.
* **Legend:** Located in the top-right corner, identifying each line with a color and label:
* MRL (Blue)
* MRL-E (Orange)
* FF (Green)
* SVD (Red)
* Slim. Net (Purple)
* Rand. LP (Brown)
### Detailed Analysis
Here's a breakdown of each line's trend and approximate data points, verifying color consistency with the legend:
* **MRL (Blue):** The line starts at approximately 68% accuracy at a representation size of 8, rises quickly to around 74% at size 16, plateaus around 76-77% between sizes 32 and 512, and remains relatively stable at approximately 77-78% for sizes 1024 and 2048.
* **MRL-E (Orange):** Starts at approximately 57% accuracy at size 8, increases rapidly to around 71% at size 16, reaches a peak of approximately 74% at size 64, and then plateaus around 74-75% for larger representation sizes.
* **FF (Green):** Begins at approximately 62% accuracy at size 8, increases steadily to around 72% at size 64, and then plateaus around 73-74% for larger representation sizes.
* **SVD (Red):** Starts at approximately 42% accuracy at size 8, exhibits a steep increase to around 68% at size 64, continues to rise to approximately 76% at size 256, and then plateaus around 77-78% for larger representation sizes.
* **Slim. Net (Purple):** Starts at approximately 65% accuracy at size 8, increases to around 73% at size 32, and then rises more gradually to approximately 76% at size 512, remaining relatively stable at around 76-77% for larger sizes.
* **Rand. LP (Brown):** Starts at approximately 42% accuracy at size 8, increases steadily to around 65% at size 128, and then rises more rapidly to approximately 74% at size 512, and plateaus around 75-76% for larger sizes.
### Key Observations
* The "MRL" model consistently achieves the highest accuracy across all representation sizes, particularly at larger sizes.
* "SVD" shows the most significant improvement in accuracy as representation size increases, starting from the lowest accuracy and eventually reaching a similar level to "MRL".
* "MRL-E", "FF", and "Slim. Net" exhibit similar accuracy trends, plateauing at around 73-76% for larger representation sizes.
* "Rand. LP" starts with the lowest accuracy but shows a substantial increase with larger representation sizes, though it remains slightly below the other models.
### Interpretation
The data suggests that increasing the representation size generally improves the Top-1 accuracy of these models. However, the rate of improvement diminishes as the representation size grows larger, indicating a point of diminishing returns. The "MRL" model appears to be the most effective in leveraging larger representation sizes, while "SVD" benefits the most from increasing representation size, starting from a lower baseline. The plateauing of accuracy for most models suggests that other factors, such as model architecture or training data, may become more limiting as representation size increases. The differences in accuracy between the models highlight the importance of model design and optimization for achieving high performance. The "Rand. LP" model's initial low accuracy and subsequent improvement suggest that it may require larger representations to effectively capture the underlying patterns in the data.