## Line Graph: Top-1 Accuracy vs. Representation Size
### Overview
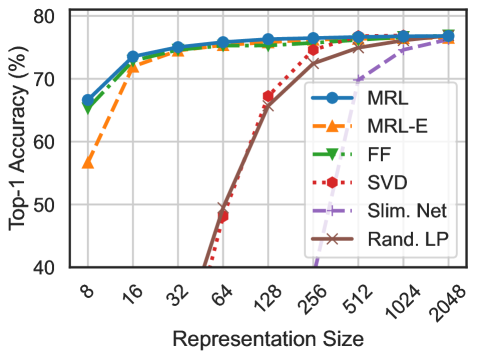
The image is a line graph comparing the Top-1 Accuracy (%) of six different methods (MRL, MRL-E, FF, SVD, Slim. Net, Rand. LP) across varying Representation Sizes (8 to 2048). The graph shows how accuracy improves or plateaus as representation size increases.
### Components/Axes
- **X-axis (Horizontal)**: Representation Size (logarithmic scale: 8, 16, 32, 64, 128, 256, 512, 1024, 2048).
- **Y-axis (Vertical)**: Top-1 Accuracy (%) (linear scale: 40% to 80%).
- **Legend**: Located in the top-right corner, mapping colors/symbols to methods:
- **Blue (solid line with circles)**: MRL
- **Orange (dashed line with triangles)**: MRL-E
- **Green (dotted line with triangles)**: FF
- **Red (dash-dot line with hexagons)**: SVD
- **Purple (dash-dot line with crosses)**: Slim. Net
- **Brown (solid line with crosses)**: Rand. LP
### Detailed Analysis
1. **MRL (Blue)**: Starts at ~65% accuracy at size 8, rises steadily to ~75% by size 16, and plateaus near 75% for larger sizes.
2. **MRL-E (Orange)**: Begins at ~55% at size 8, increases sharply to ~70% by size 16, and plateaus near 70% for larger sizes.
3. **FF (Green)**: Starts at ~60% at size 8, rises to ~70% by size 16, and plateaus near 70% for larger sizes.
4. **SVD (Red)**: Begins at ~50% at size 8, rises steeply to ~70% by size 128, and plateaus near 70% for larger sizes.
5. **Slim. Net (Purple)**: Starts at ~45% at size 8, increases gradually to ~70% by size 1024, and plateaus near 70% for larger sizes.
6. **Rand. LP (Brown)**: Starts at ~40% at size 8, rises sharply to ~70% by size 1024, and plateaus near 70% for larger sizes.
### Key Observations
- **Performance Trends**: All methods improve accuracy with larger representation sizes, but MRL and MRL-E achieve the highest initial accuracy and plateau earlier.
- **Steepest Growth**: Rand. LP and SVD show the most significant improvement as representation size increases, though they start from lower baselines.
- **Plateaus**: Most methods plateau near 70–75% accuracy, suggesting diminishing returns at larger sizes.
- **Outliers**: Slim. Net and Rand. LP lag behind others initially but catch up at larger sizes.
### Interpretation
The graph demonstrates that **MRL and MRL-E** are the most efficient methods, achieving high accuracy even at smaller representation sizes. In contrast, **Rand. LP** and **SVD** require larger representations to reach comparable performance, indicating they may be less efficient but potentially more scalable. The plateauing trends suggest that increasing representation size beyond a certain point yields minimal accuracy gains for most methods. This could inform trade-offs between computational cost and performance in practical applications.