## Diagram: Information Source and Outputs
### Overview
The image is a flowchart or conceptual diagram illustrating the relationship between a source text and two derived outputs, categorized as "Intrinsic" and "Extrinsic." The diagram is structured with a source block at the top and an outputs section below, enclosed within a dashed border.
### Components/Axes
The diagram consists of the following labeled components and text blocks:
1. **Top Section: "Source"**
* A centered, bold heading: **Source**
* Below it, a yellow rectangular box with a gold border containing a paragraph of text.
2. **Bottom Section: "Outputs"**
* A centered, bold heading: **Outputs**
* This section is enclosed by a black dashed rectangular border.
* Inside the dashed border, two columns are labeled with bold headings:
* Left Column: **Intrinsic**
* Right Column: **Extrinsic**
* Under each column heading is a pink rectangular box with a red border containing a statement.
### Detailed Analysis / Content Details
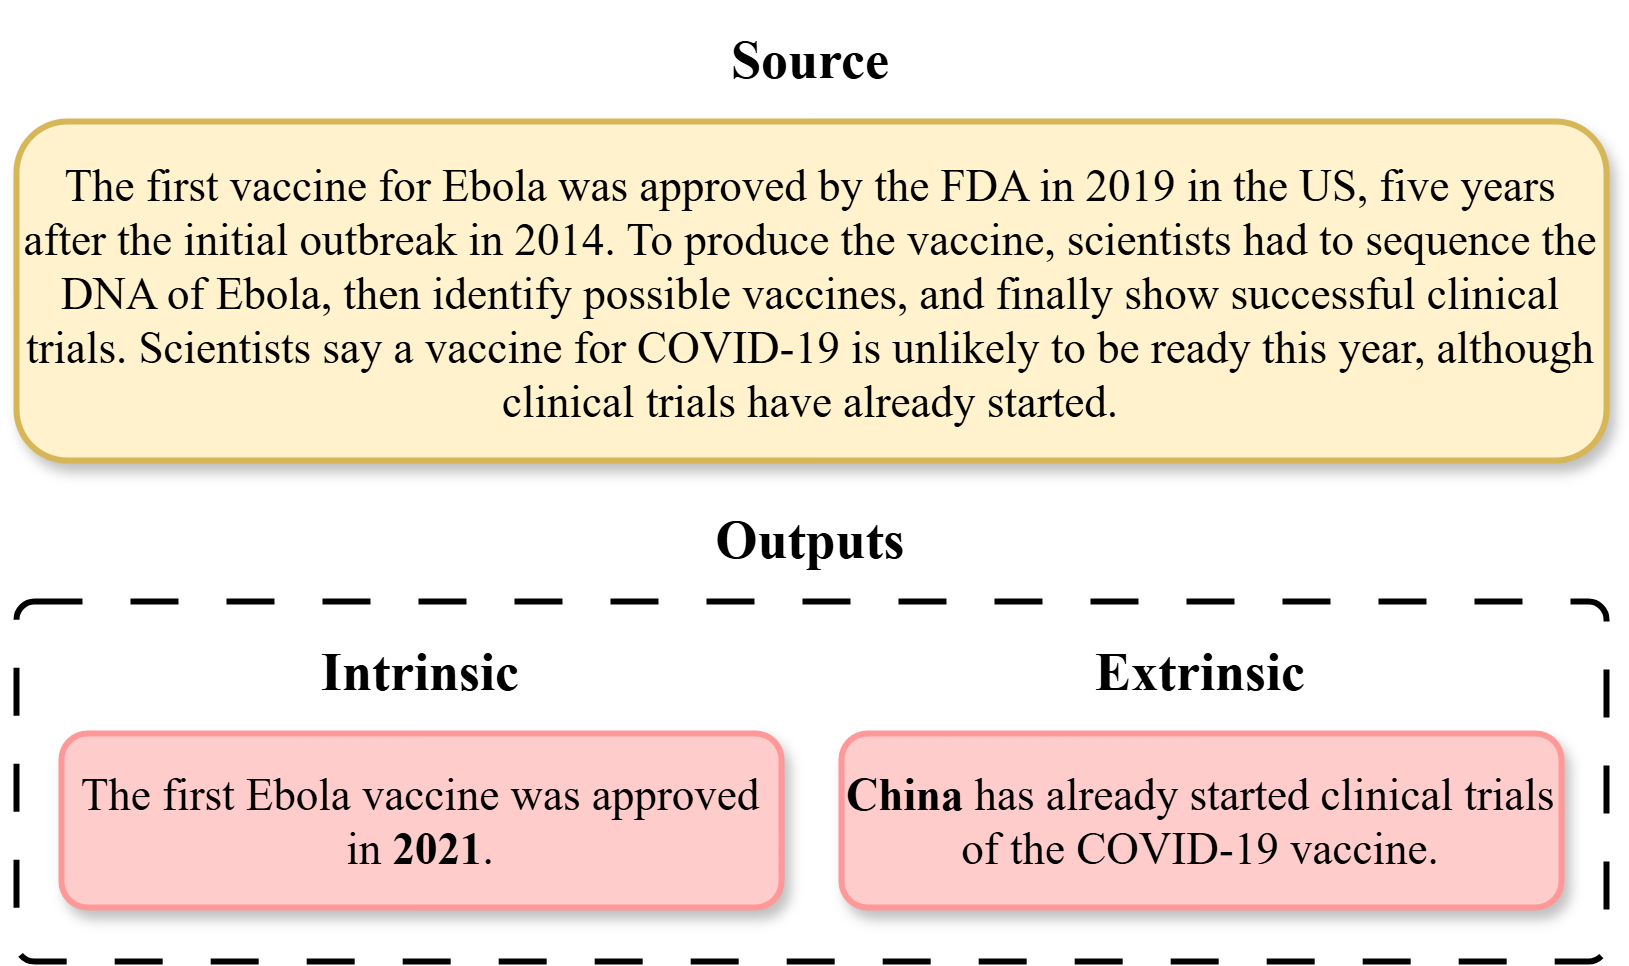
**Source Text (Yellow Box):**
> The first vaccine for Ebola was approved by the FDA in 2019 in the US, five years after the initial outbreak in 2014. To produce the vaccine, scientists had to sequence the DNA of Ebola, then identify possible vaccines, and finally show successful clinical trials. Scientists say a vaccine for COVID-19 is unlikely to be ready this year, although clinical trials have already started.
**Outputs (Within Dashed Border):**
* **Intrinsic Output (Left Pink Box):**
> The first Ebola vaccine was approved in **2021**.
* *Note: The year "2021" is in bold.*
* **Extrinsic Output (Right Pink Box):**
> **China** has already started clinical trials of the COVID-19 vaccine.
* *Note: The word "China" is in bold.*
### Key Observations
1. **Factual Discrepancy:** The "Intrinsic" output contains a factual error when compared to the source. The source states the Ebola vaccine was approved in **2019**, while the intrinsic output claims it was approved in **2021**.
2. **Information Addition:** The "Extrinsic" output introduces new, specific information not present in the source text. The source mentions that "clinical trials have already started" for a COVID-19 vaccine, but does not specify a country. The extrinsic output explicitly names **China** as the location where trials have started.
3. **Structural Relationship:** The diagram visually separates the original information ("Source") from two types of derived information. The "Intrinsic" output appears to be a (flawed) restatement or extraction from the source, while the "Extrinsic" output adds external context or specification.
### Interpretation
This diagram serves as a conceptual model for analyzing information provenance and transformation. It demonstrates two potential pathways when processing a source text:
* **Intrinsic Analysis:** This involves extracting or restating information directly from the source. The diagram highlights a critical risk here: the potential for introducing errors during this process, as evidenced by the incorrect date (2021 vs. 2019). This could represent misreading, memory error, or faulty summarization.
* **Extrinsic Analysis:** This involves augmenting the source information with external knowledge or context. The diagram shows this as adding a specific detail (China) that is plausible but not contained within the original source text. This could represent informed inference, the addition of background knowledge, or potentially, the introduction of unsupported assumptions.
The overall message concerns the reliability and nature of information derived from a primary source. It underscores the importance of verifying intrinsic claims against the original and being cautious about the origins of extrinsic additions. The diagram could be used in contexts discussing fact-checking, information literacy, data extraction pipelines, or the difference between summarization and interpretation.